Overview
TODO: Add a couple paragraphs on the problem this project solves: what the legacy monitoring setup looked like, why the team is moving to OpenShift/Kubernetes, and what "done" looks like for this migration.
What This Involves
- Containerised deployment and lifecycle management of Grafana, Prometheus, Loki, and Alloy on OpenShift.
- Configuring data sources, service discovery, and role-based access control for the stack.
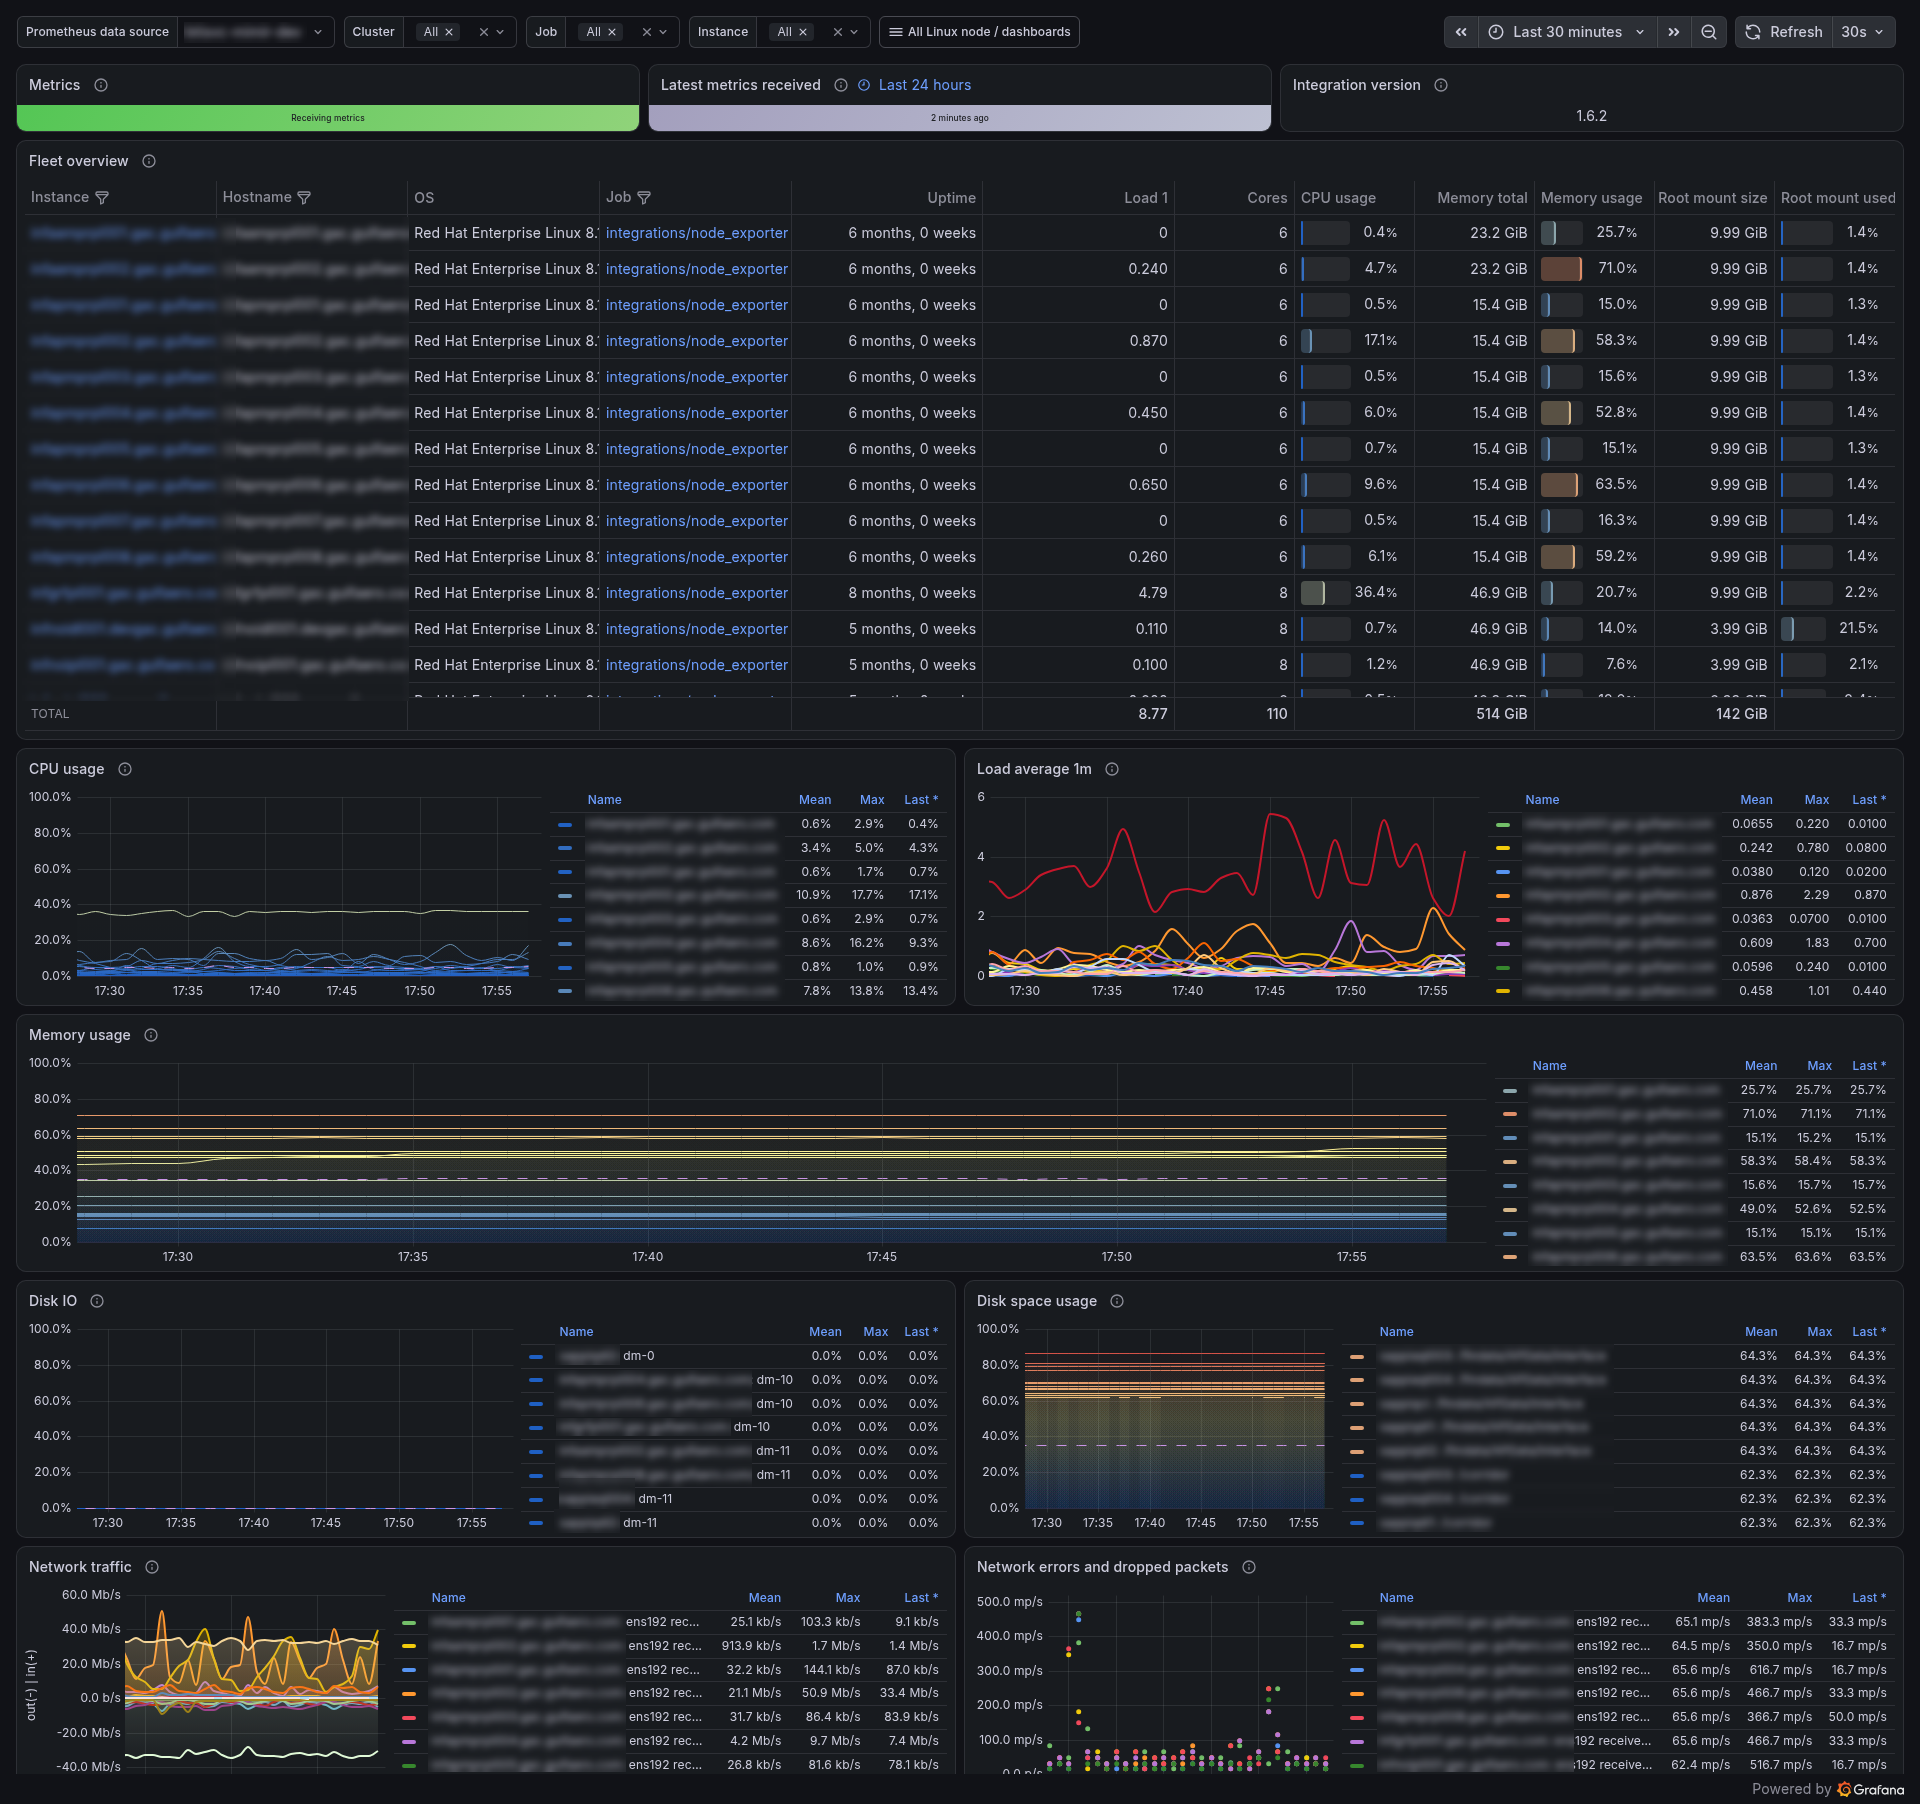
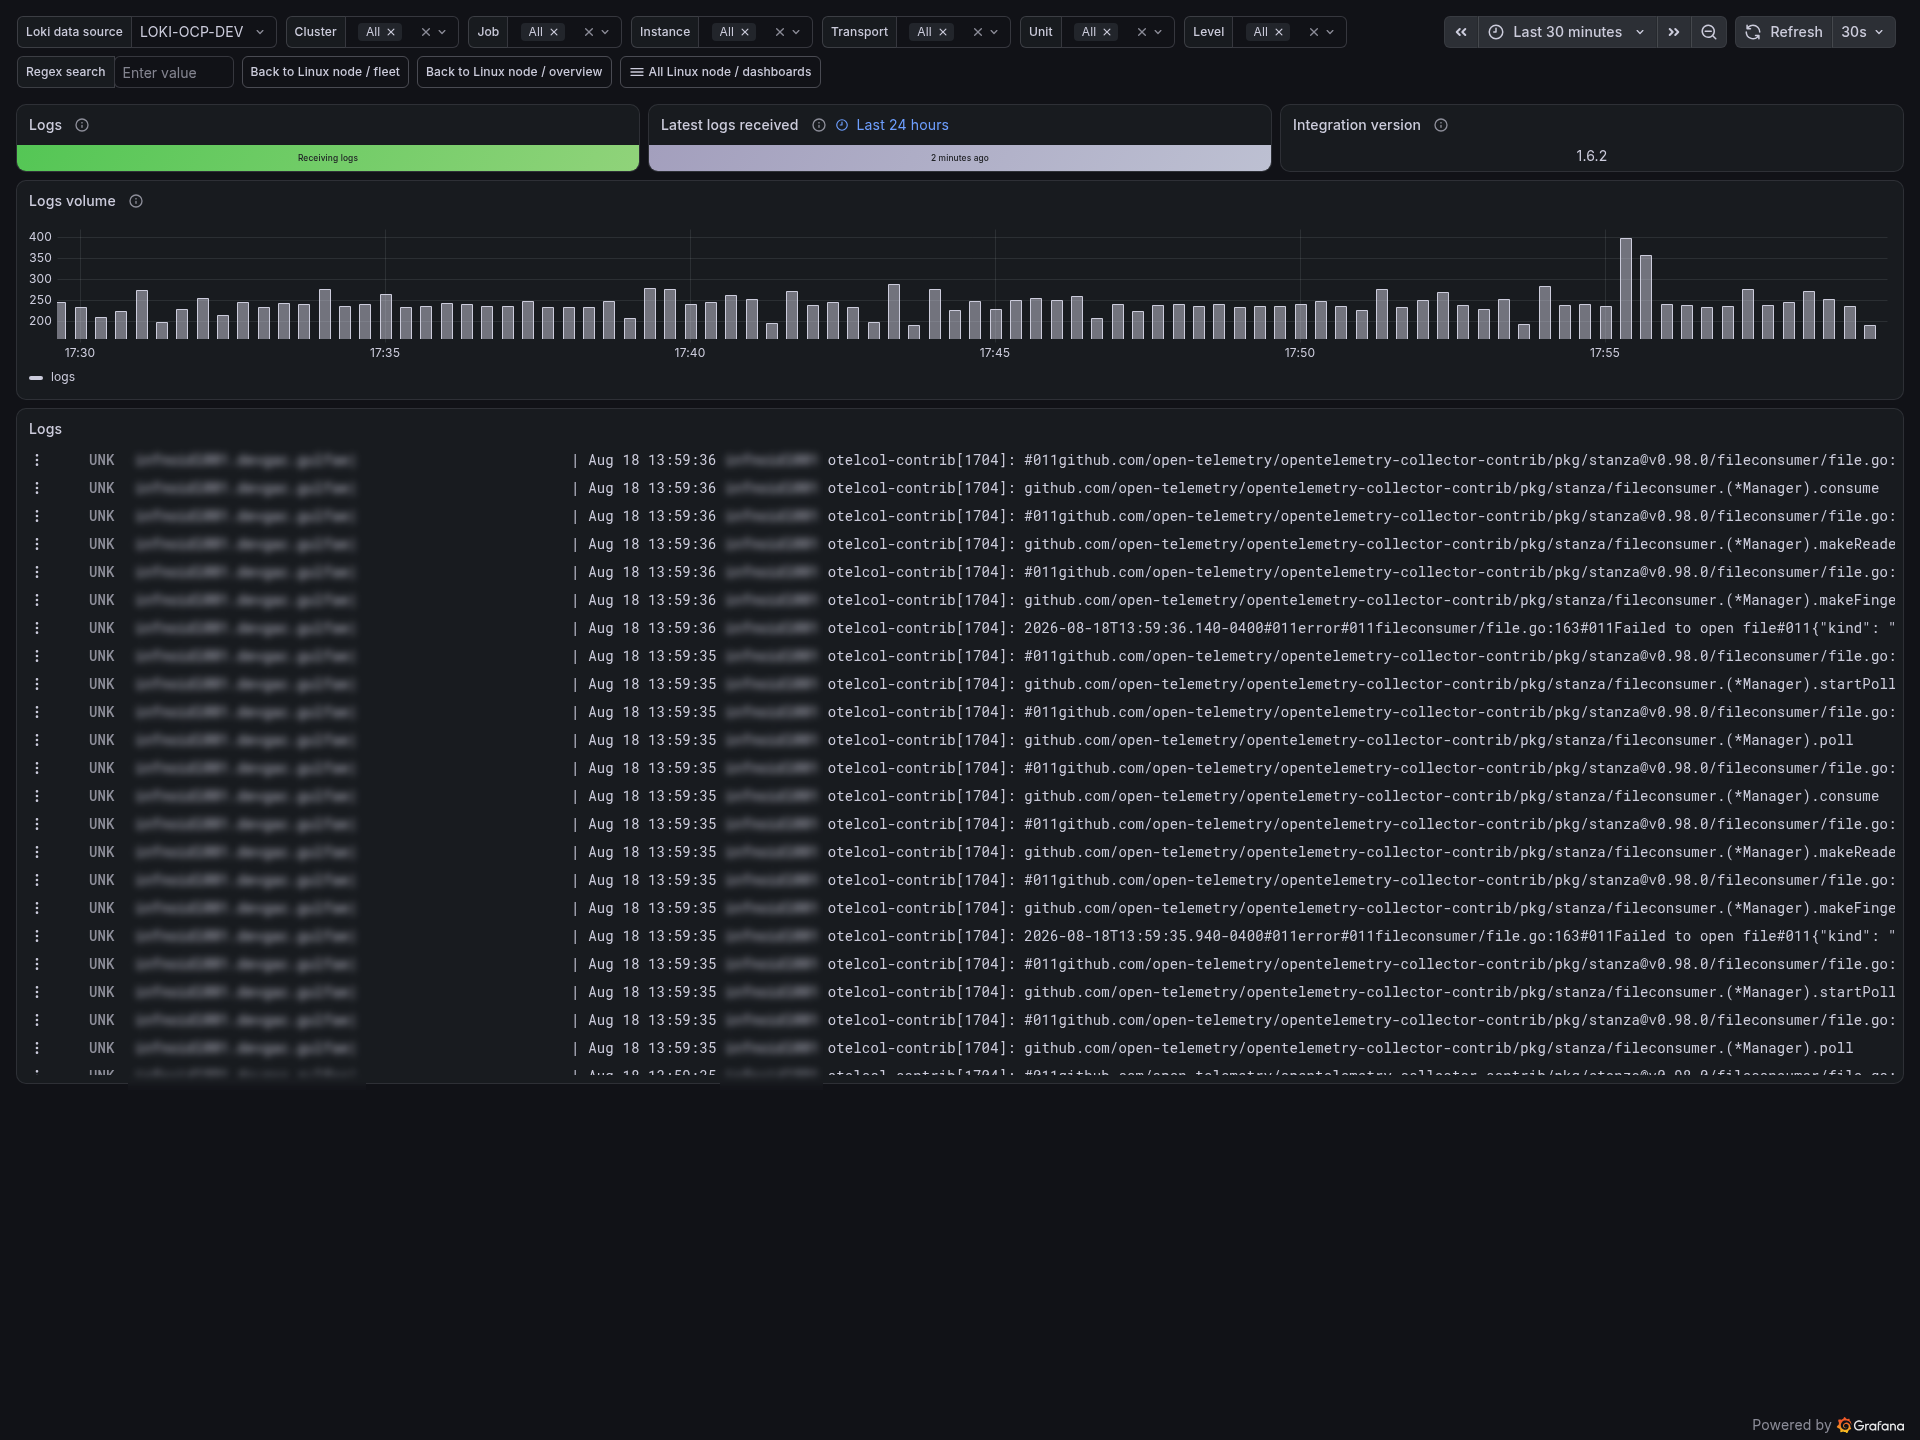
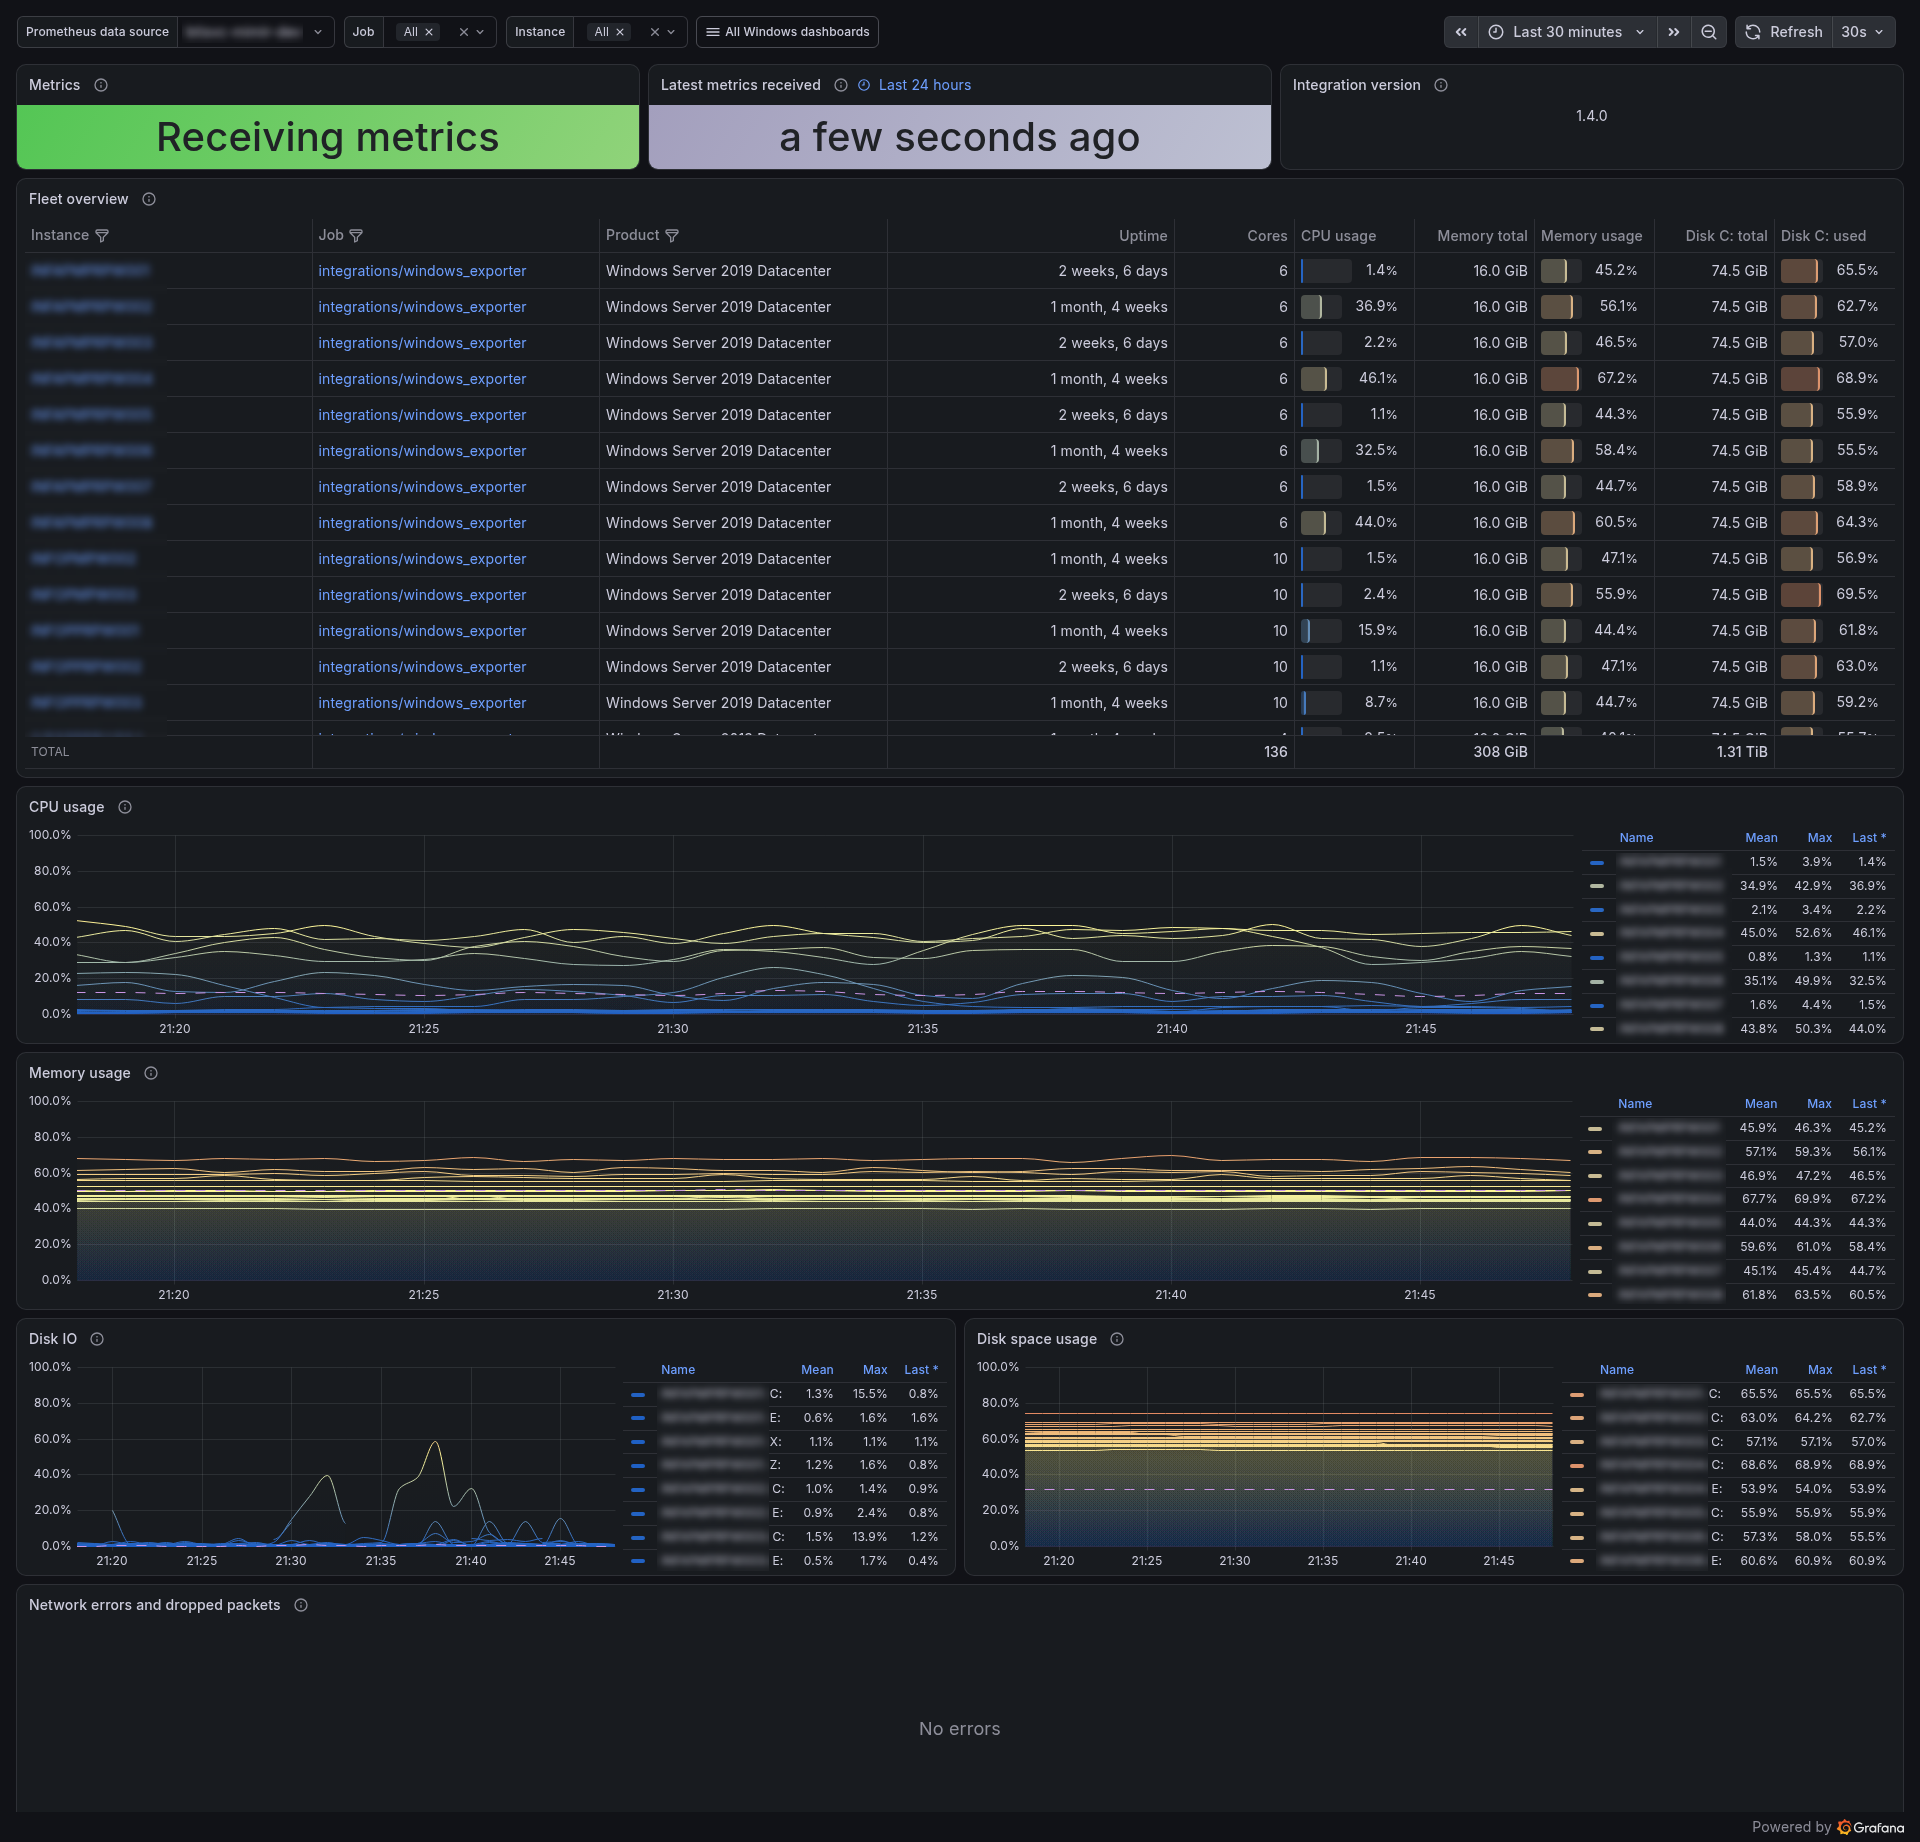
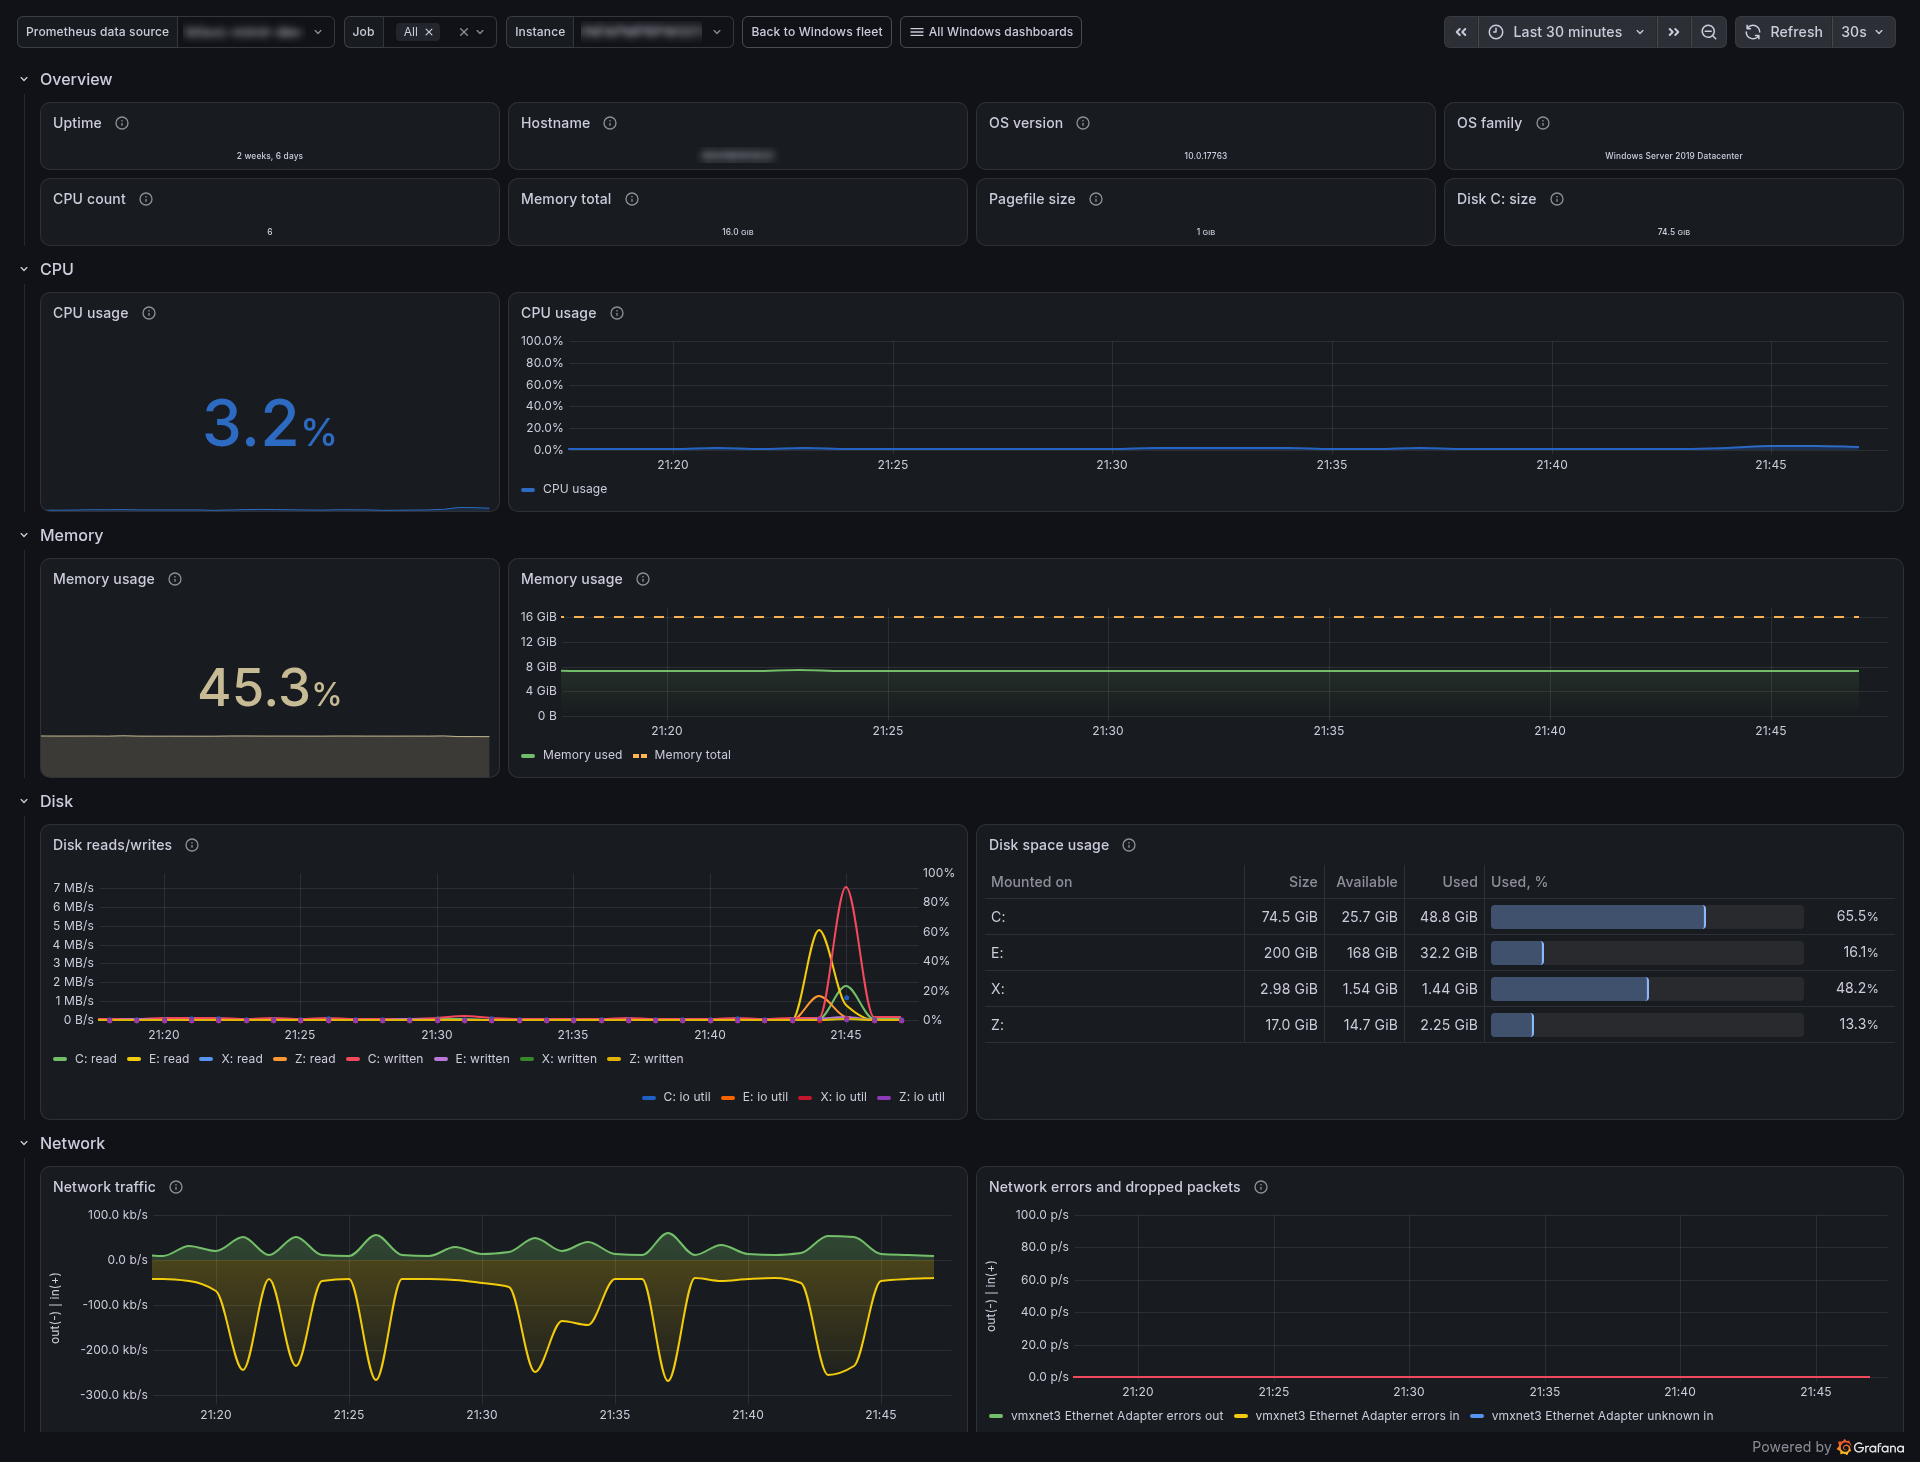
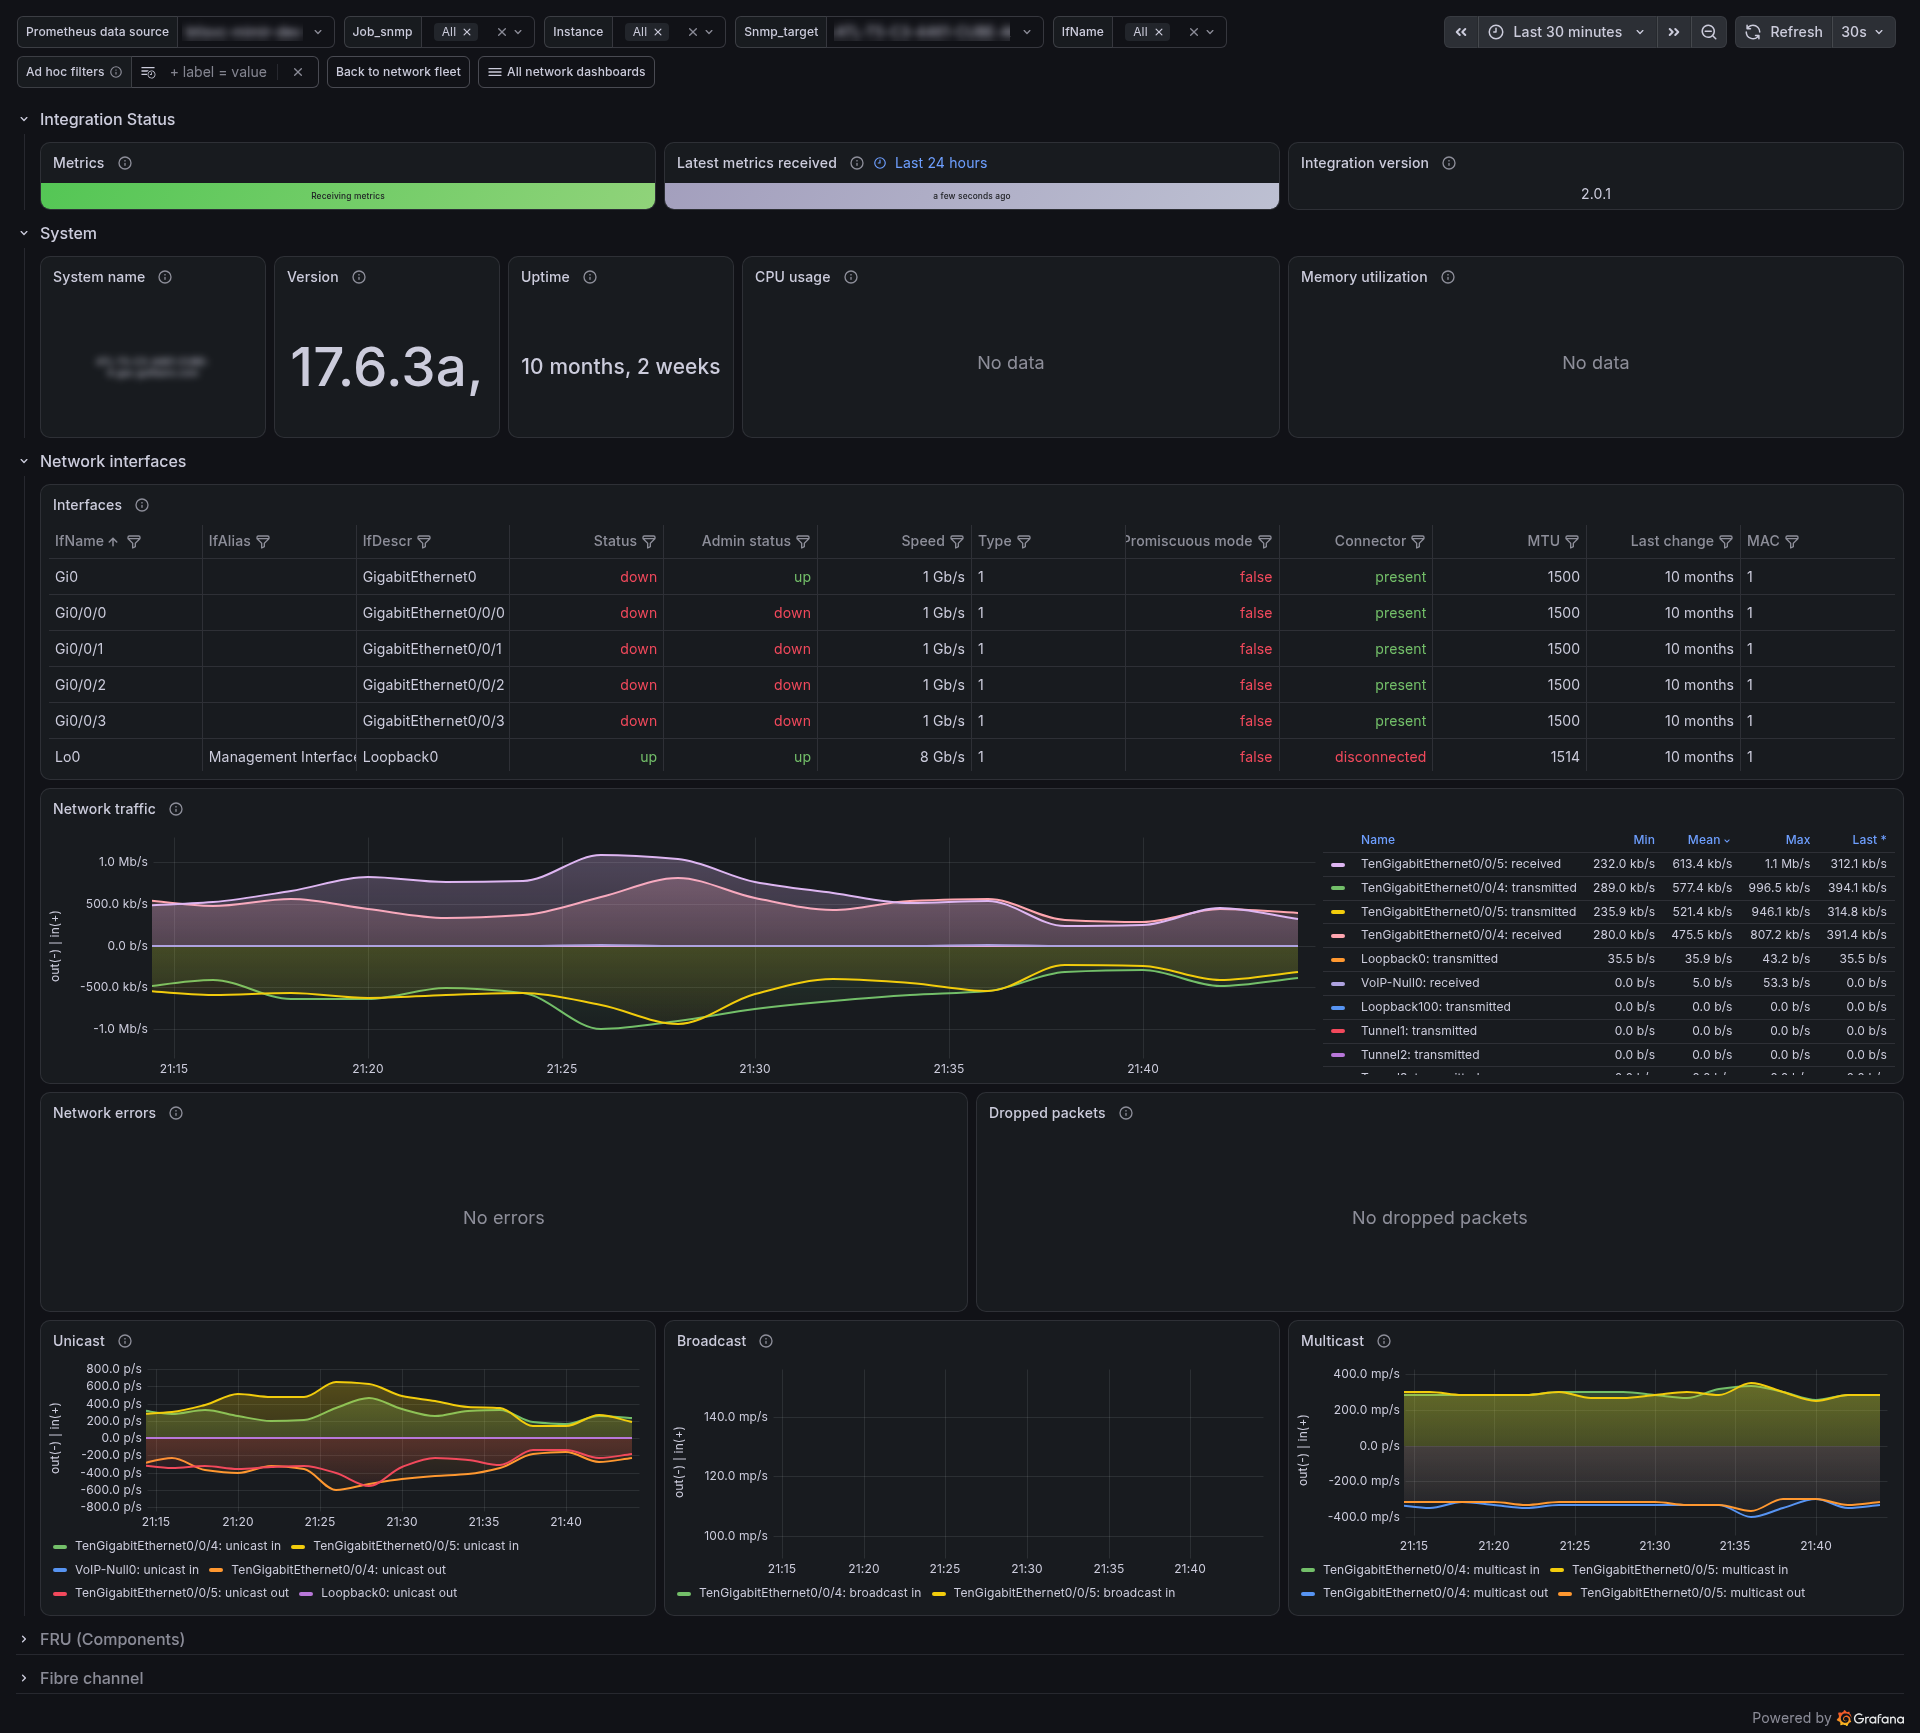
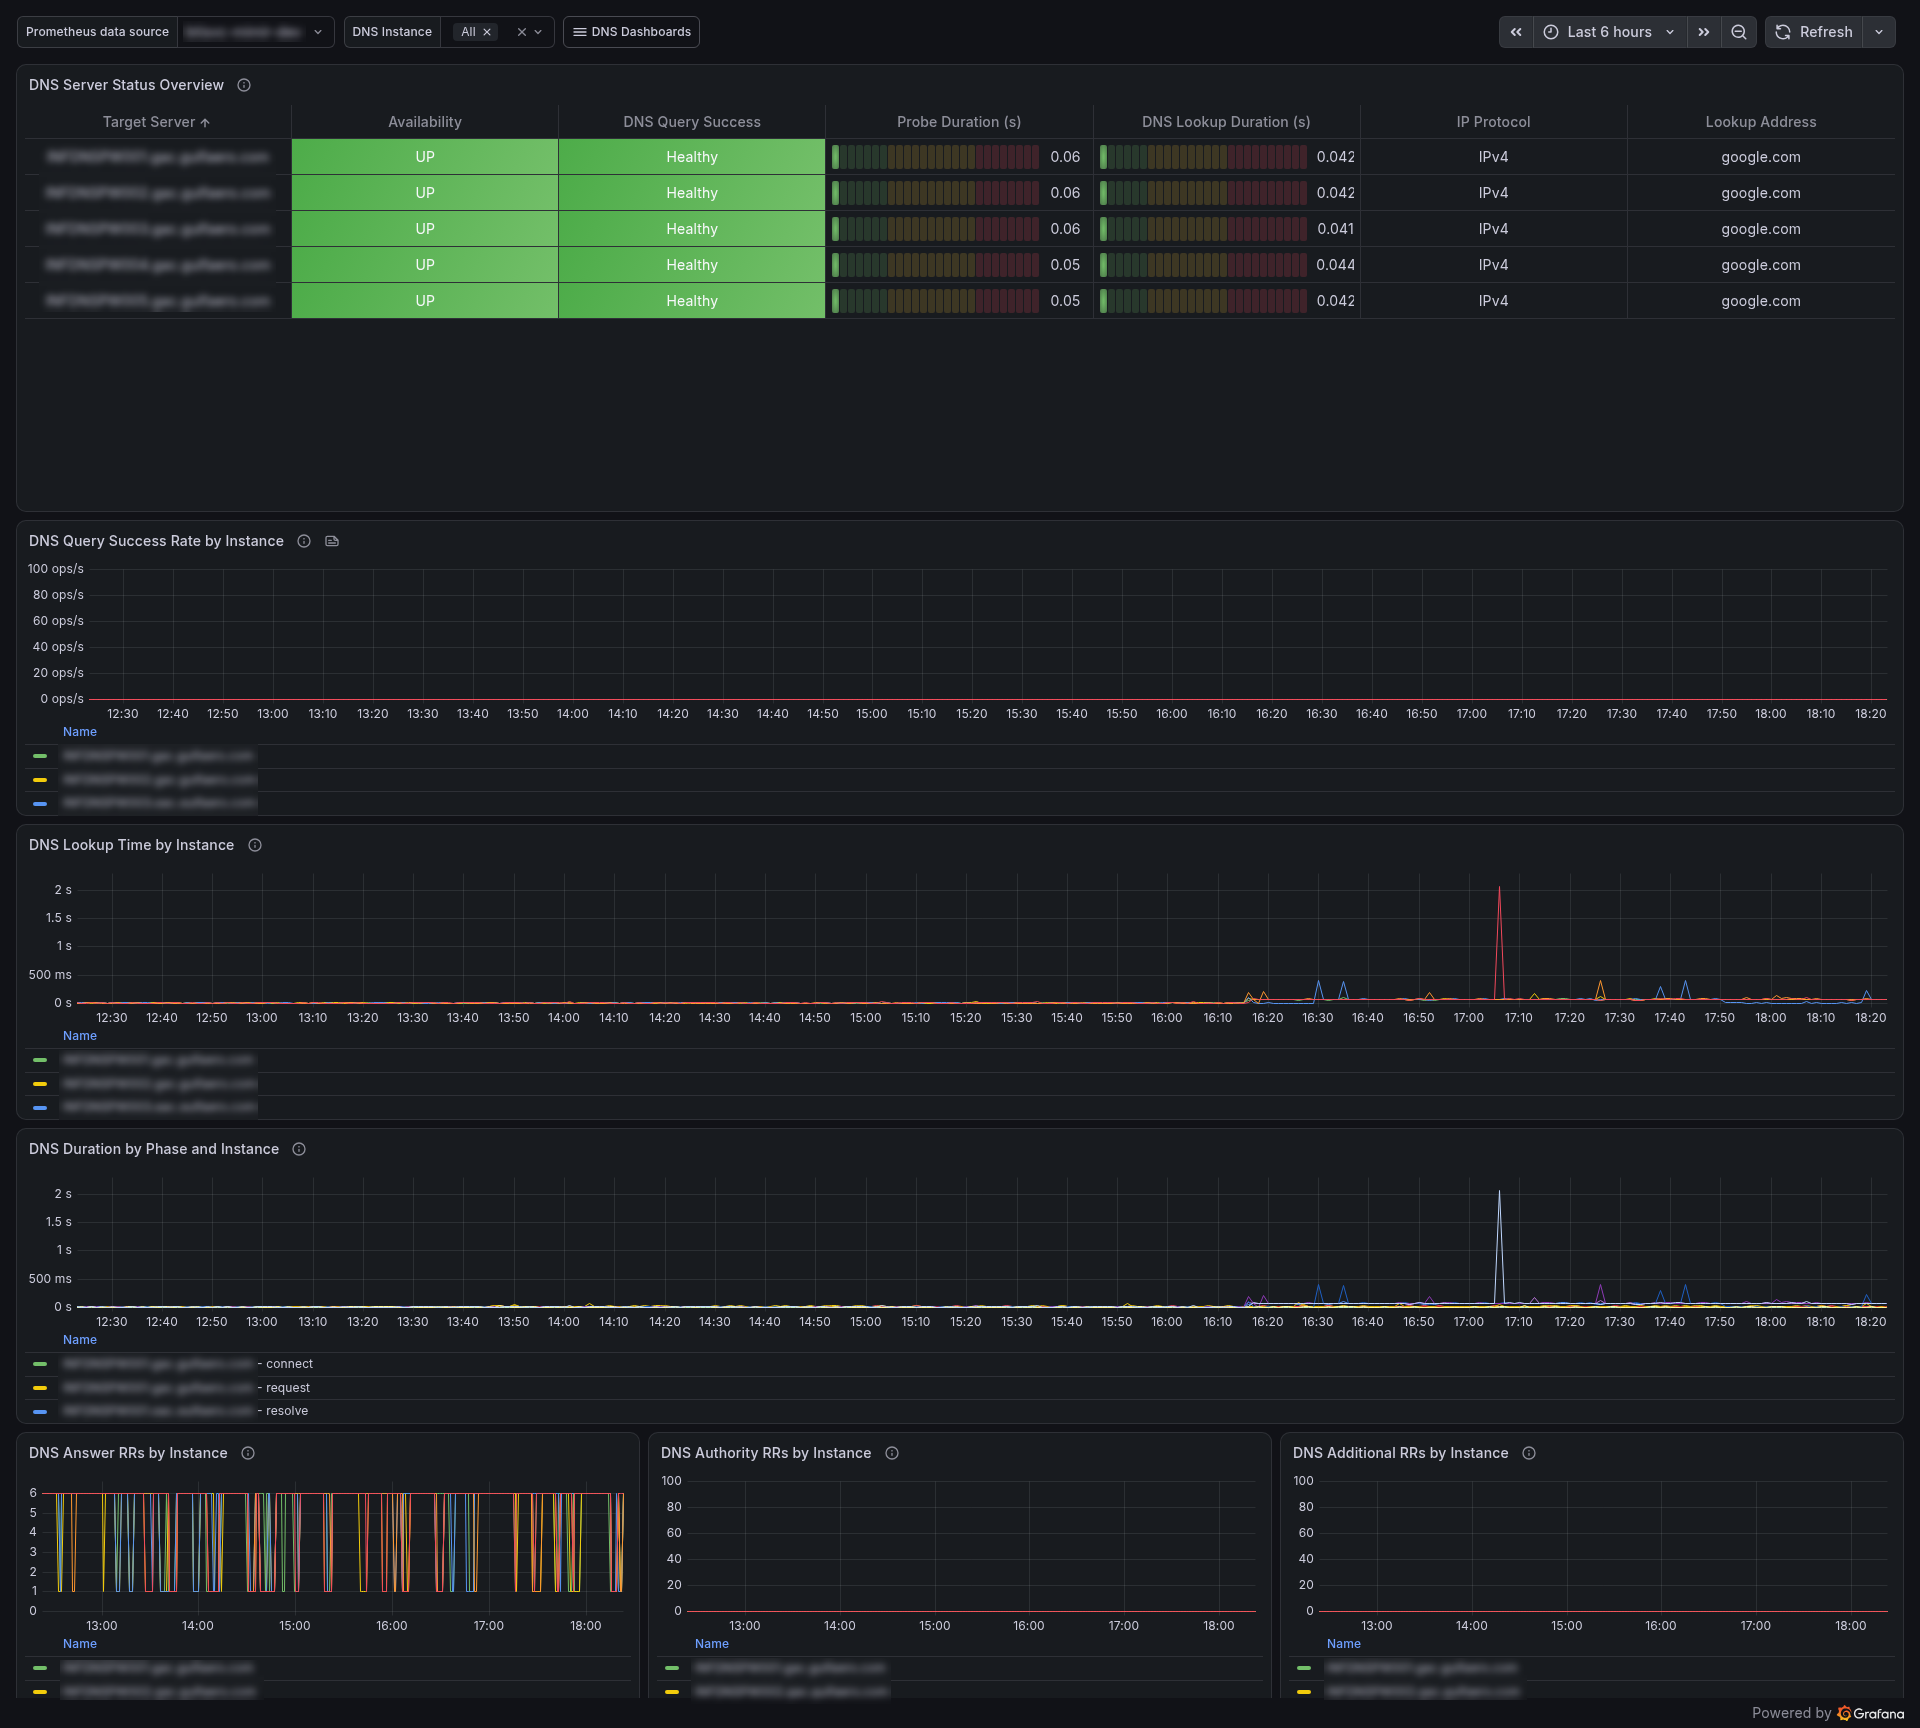
- Rebuilding existing dashboards and alerting rules to run natively on the new platform.
- TODO: Add more detail: Helm charts / Kustomize / GitOps workflow, storage & persistence strategy, networking & ingress, scaling and resource limits, etc.
Screenshots
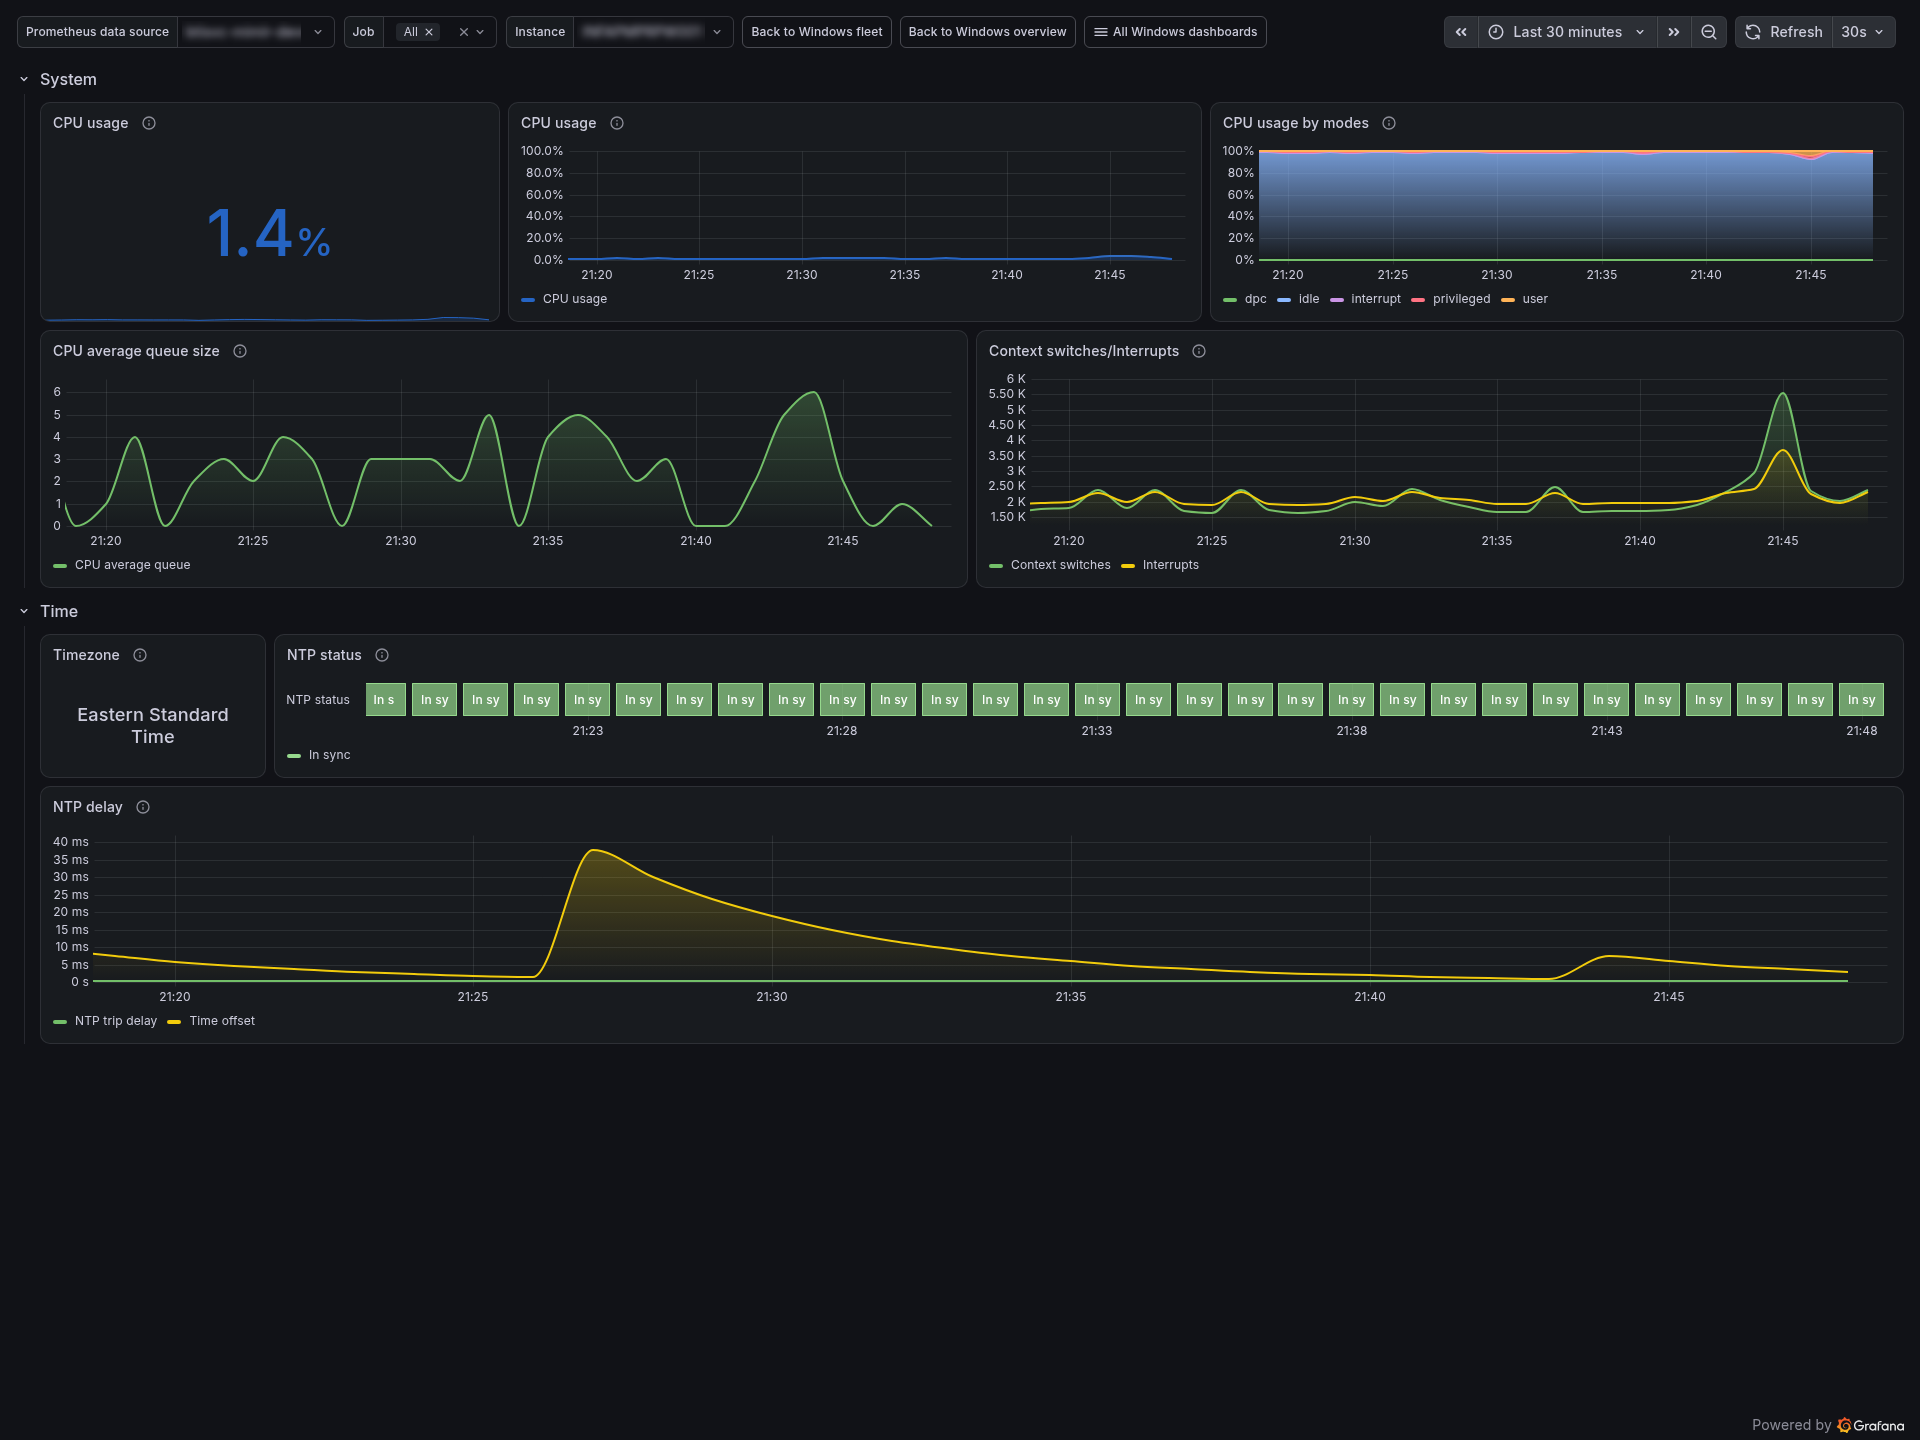
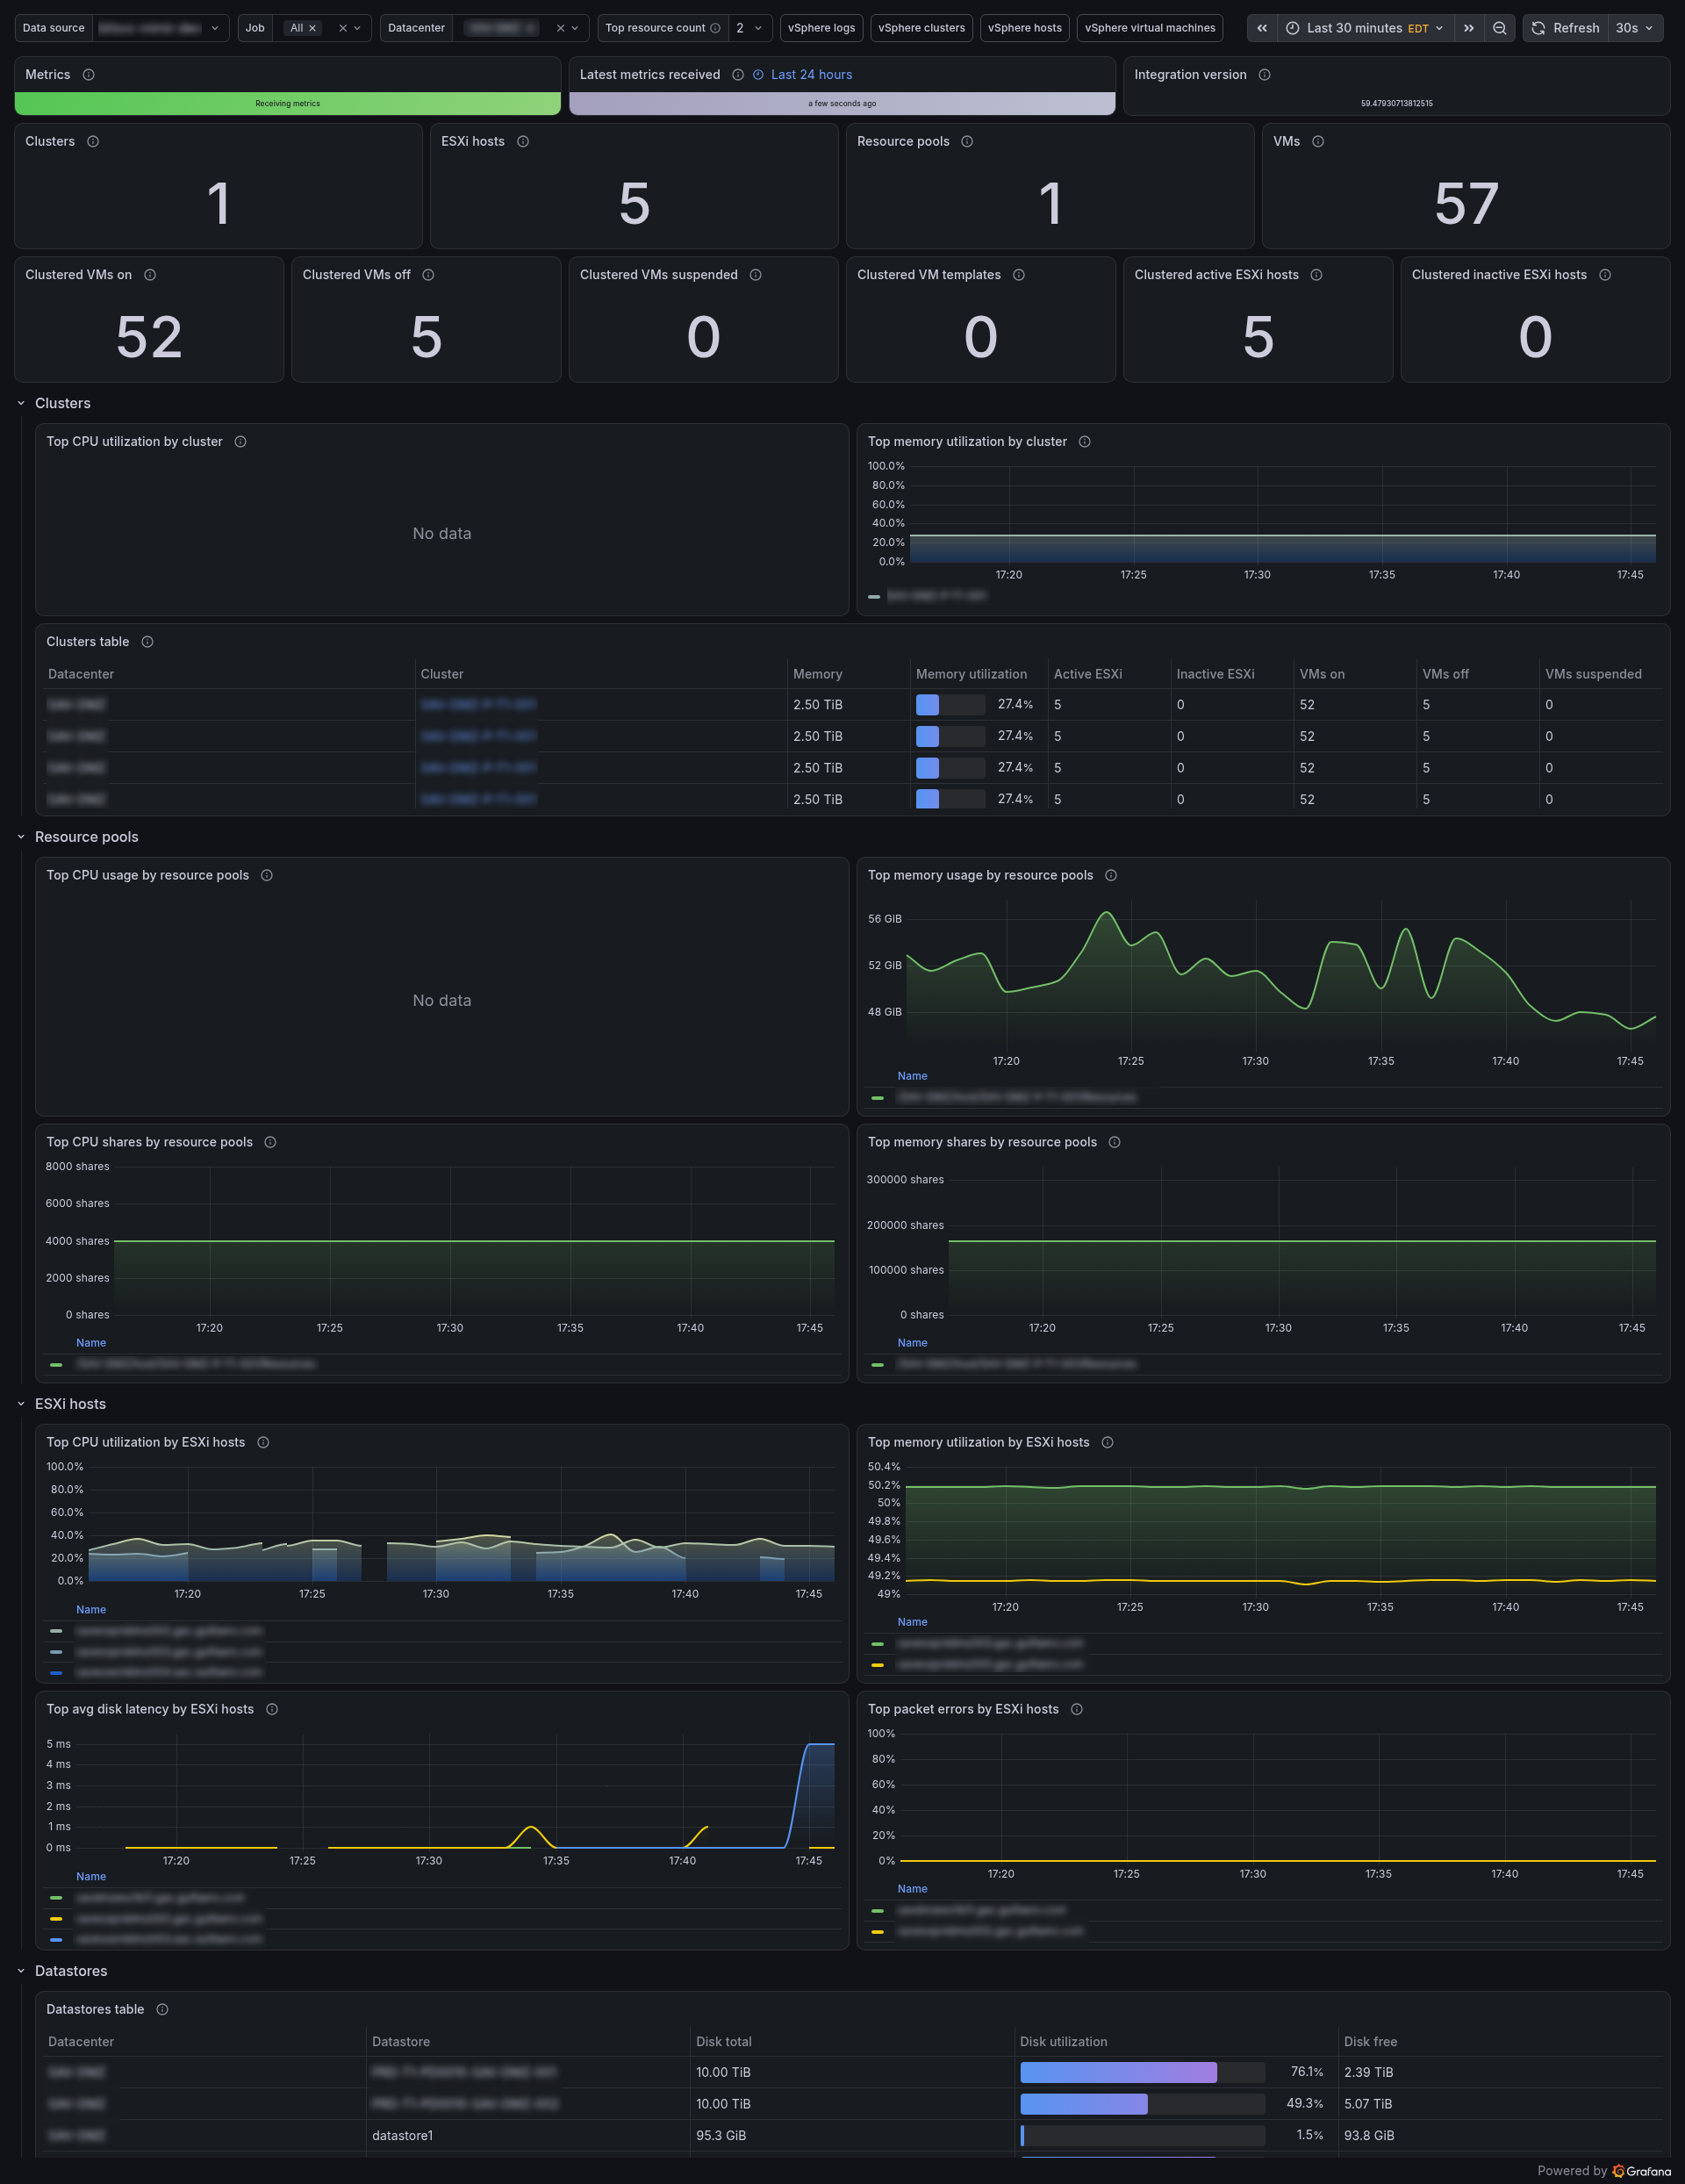
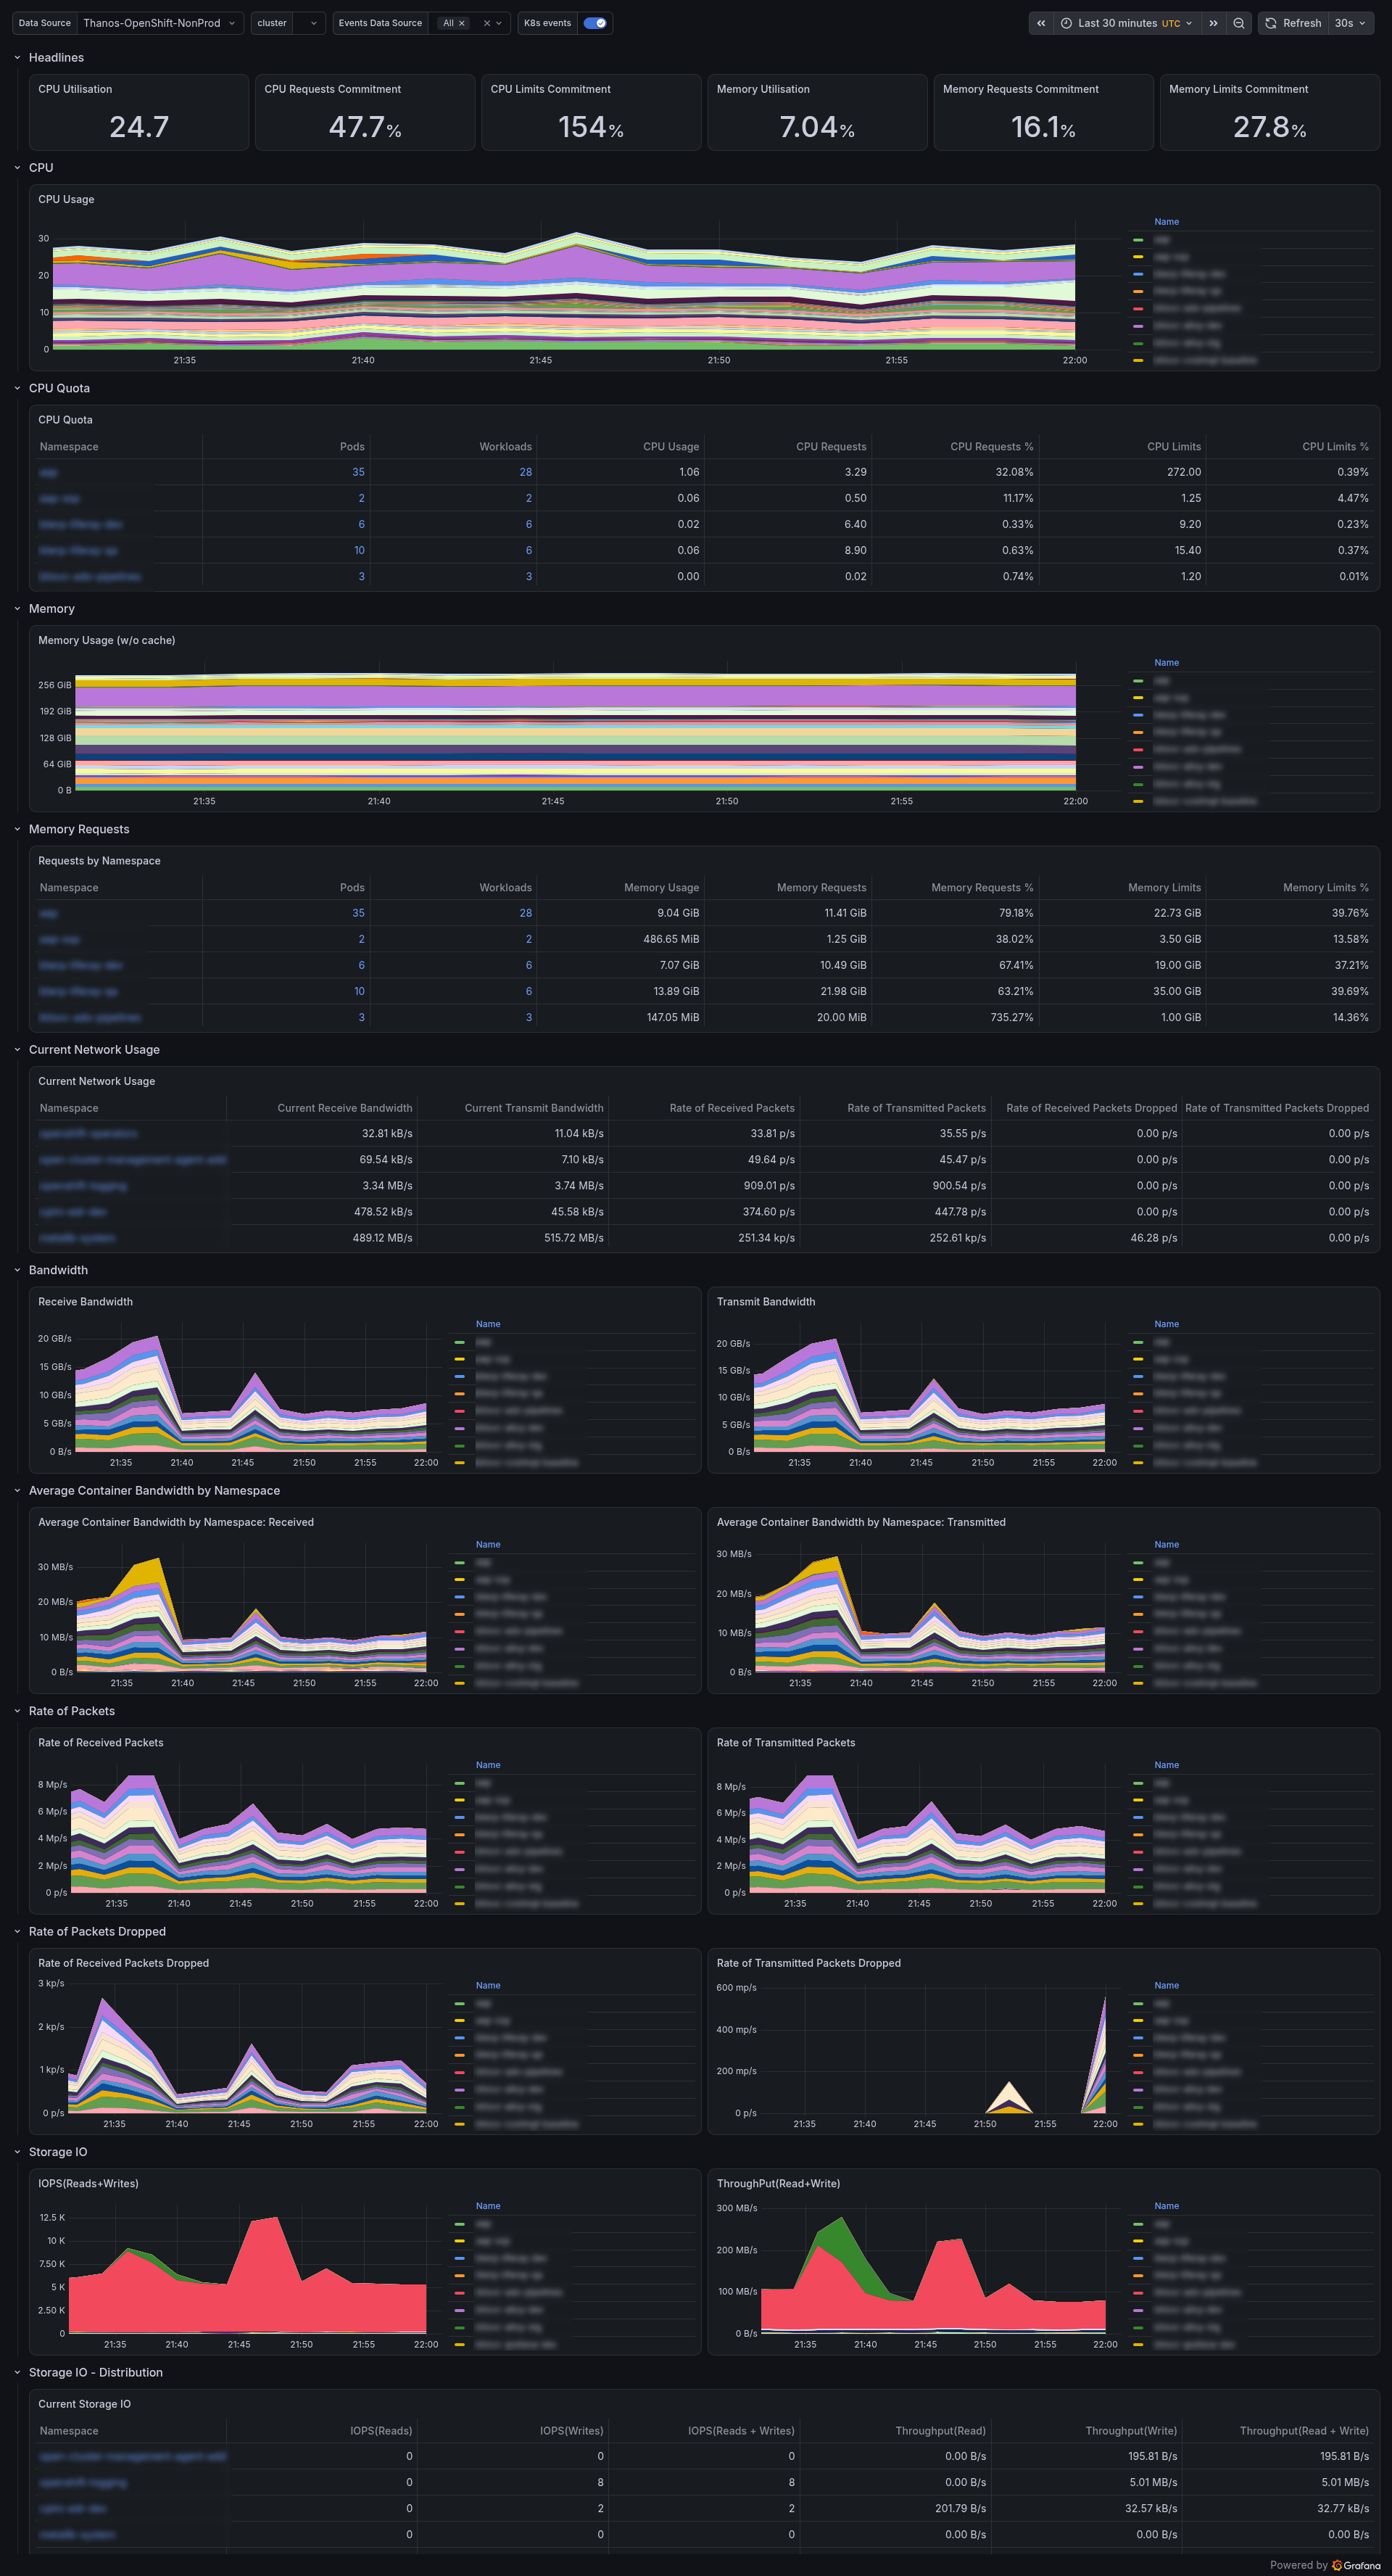
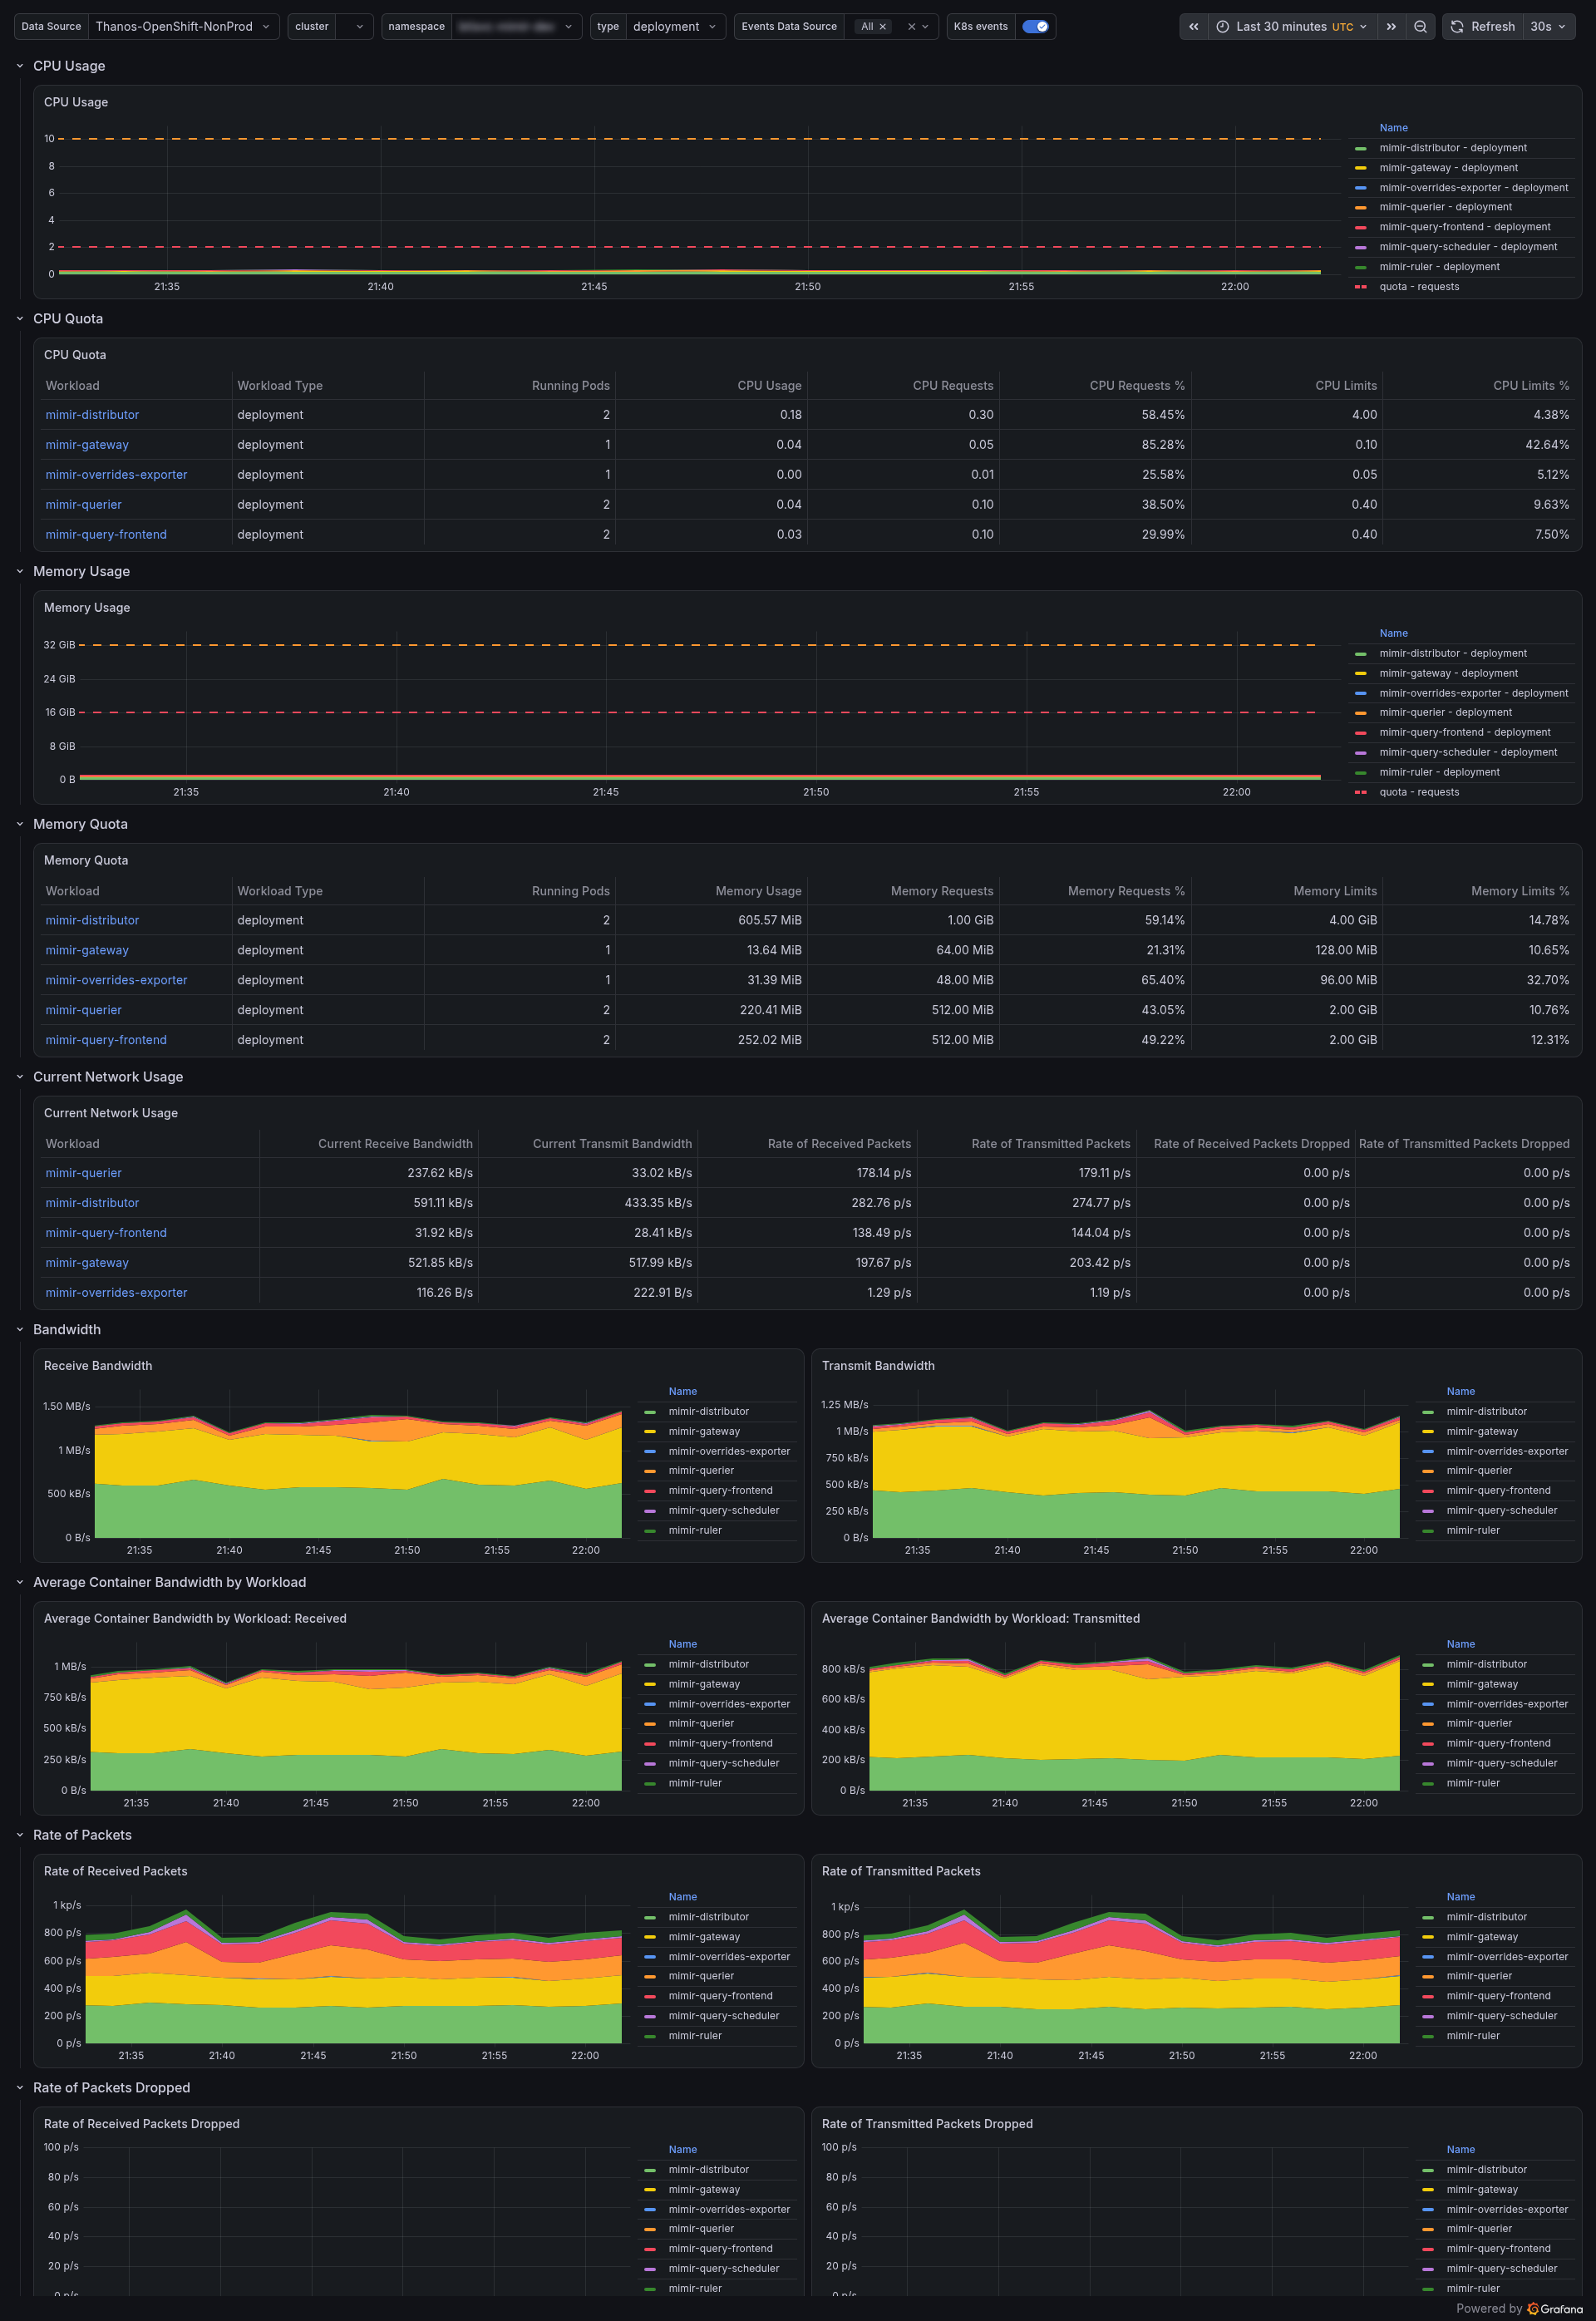
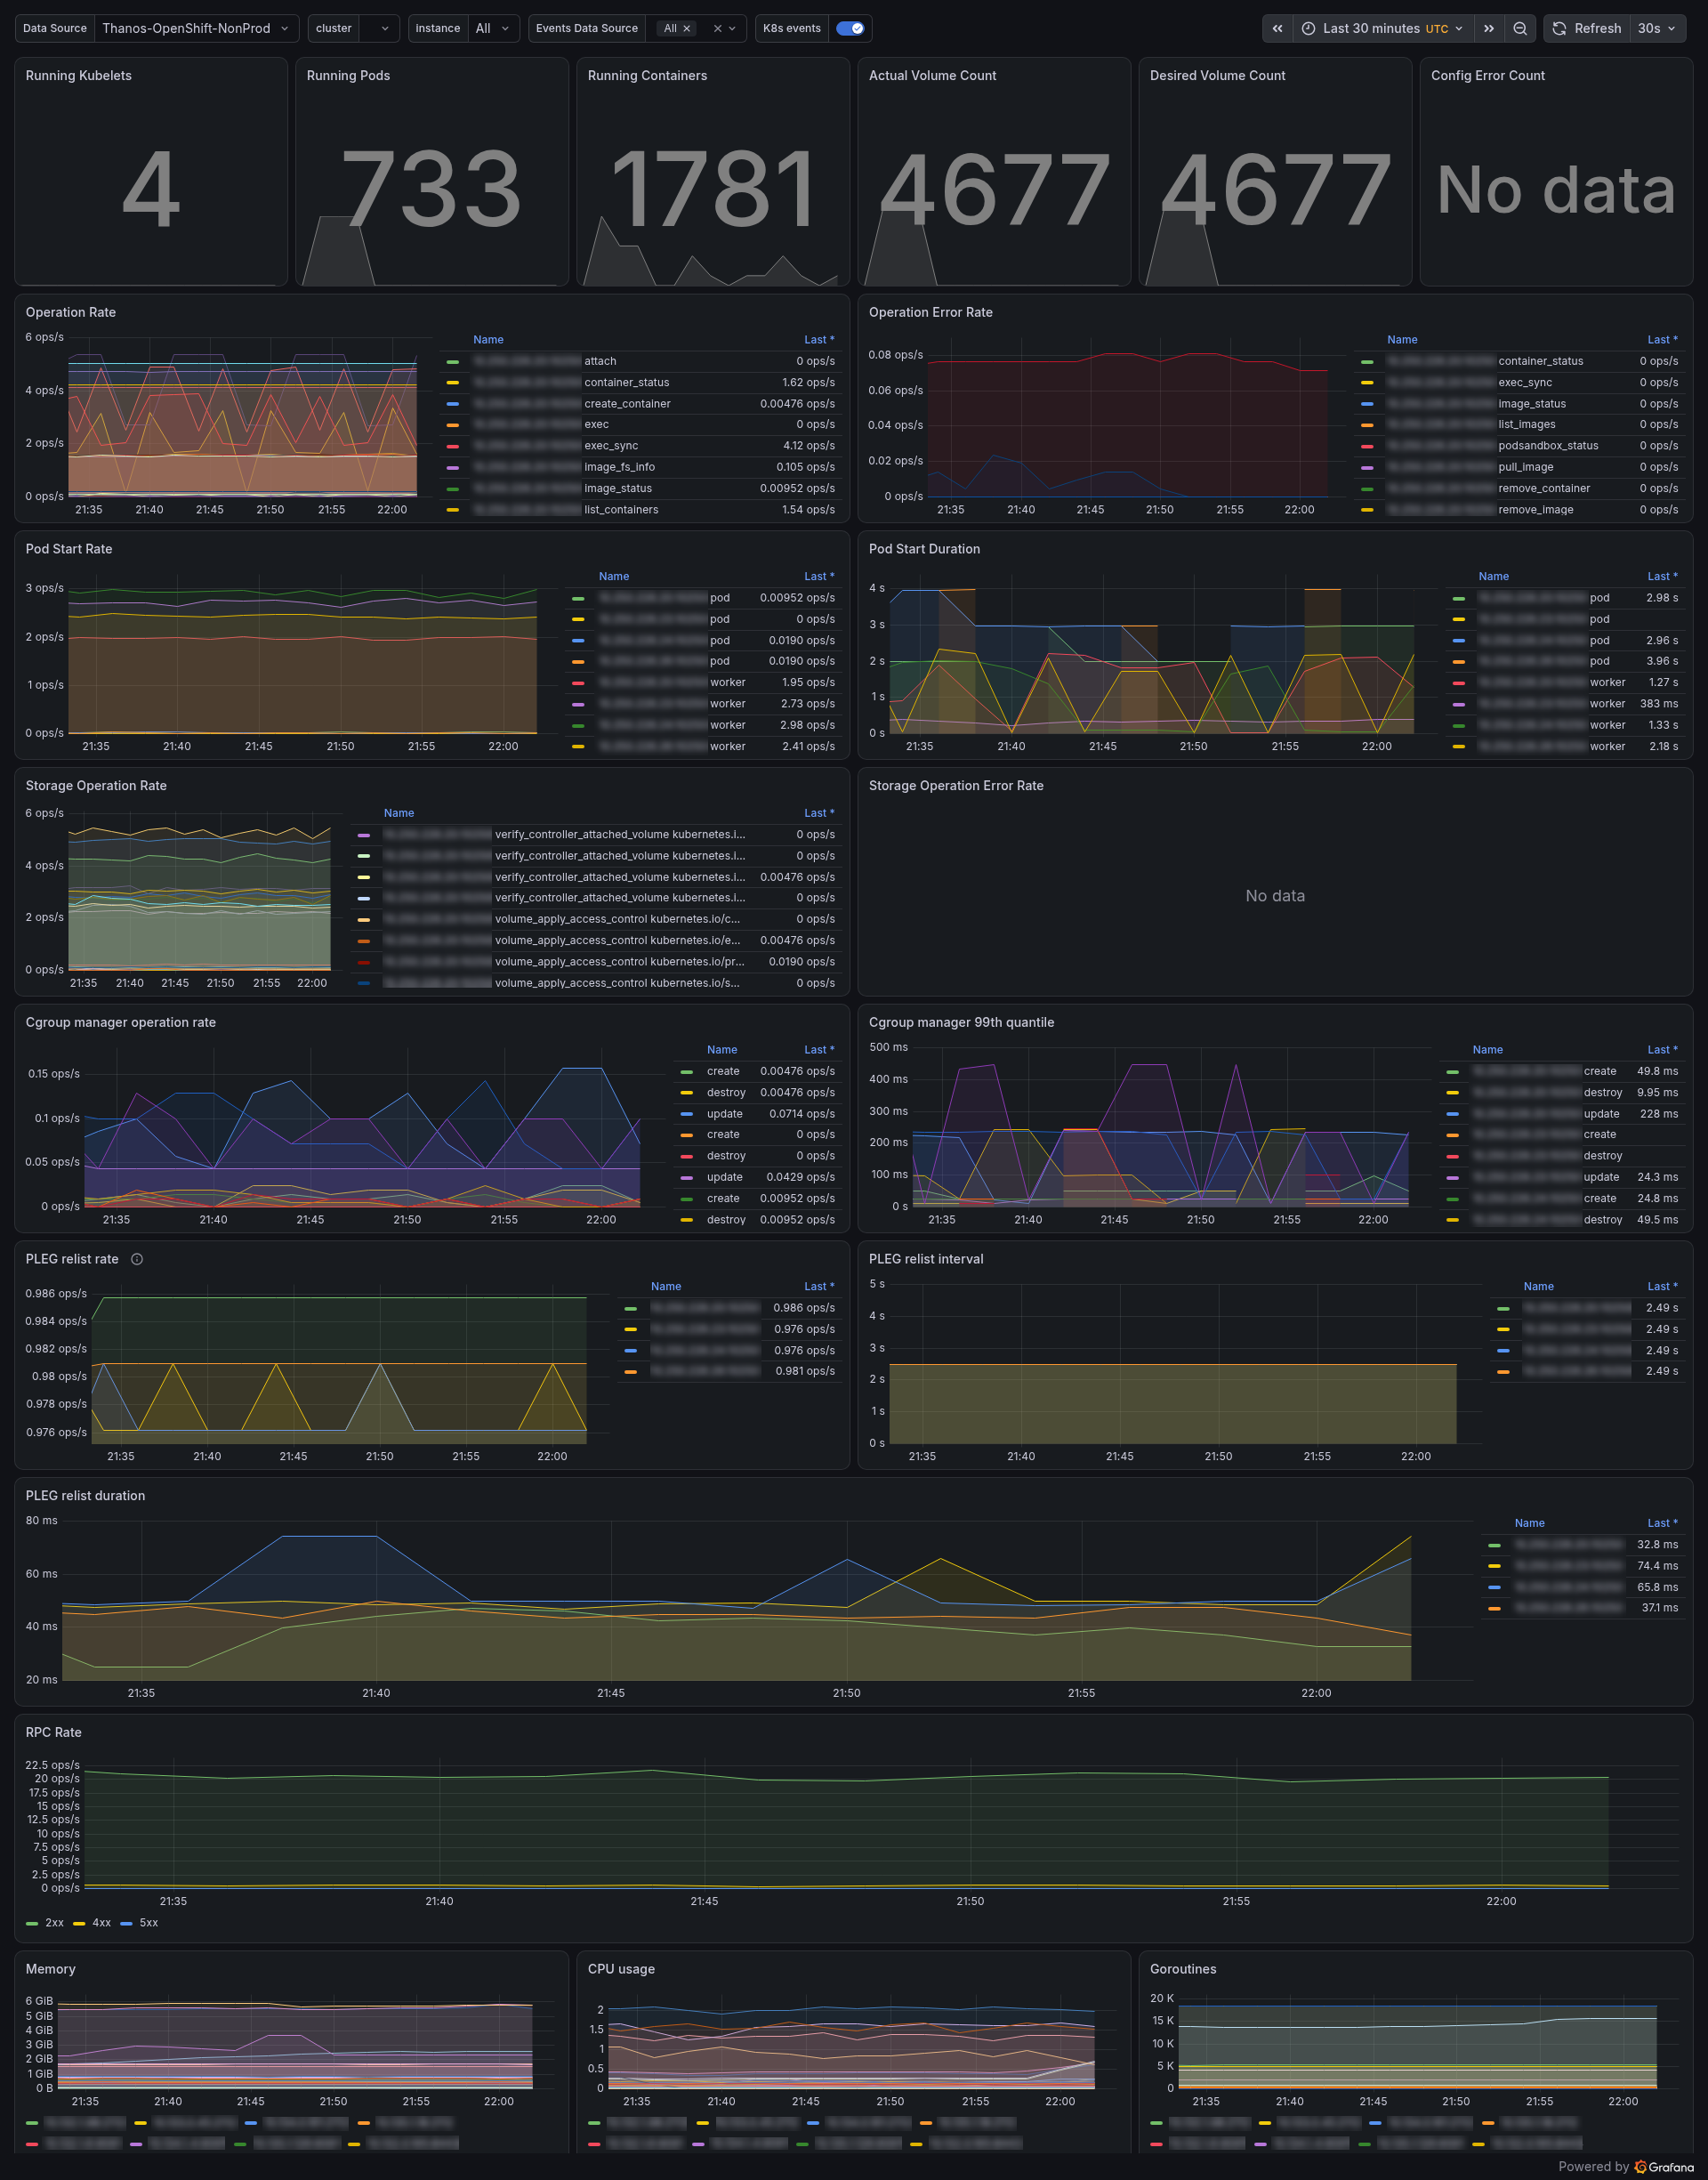
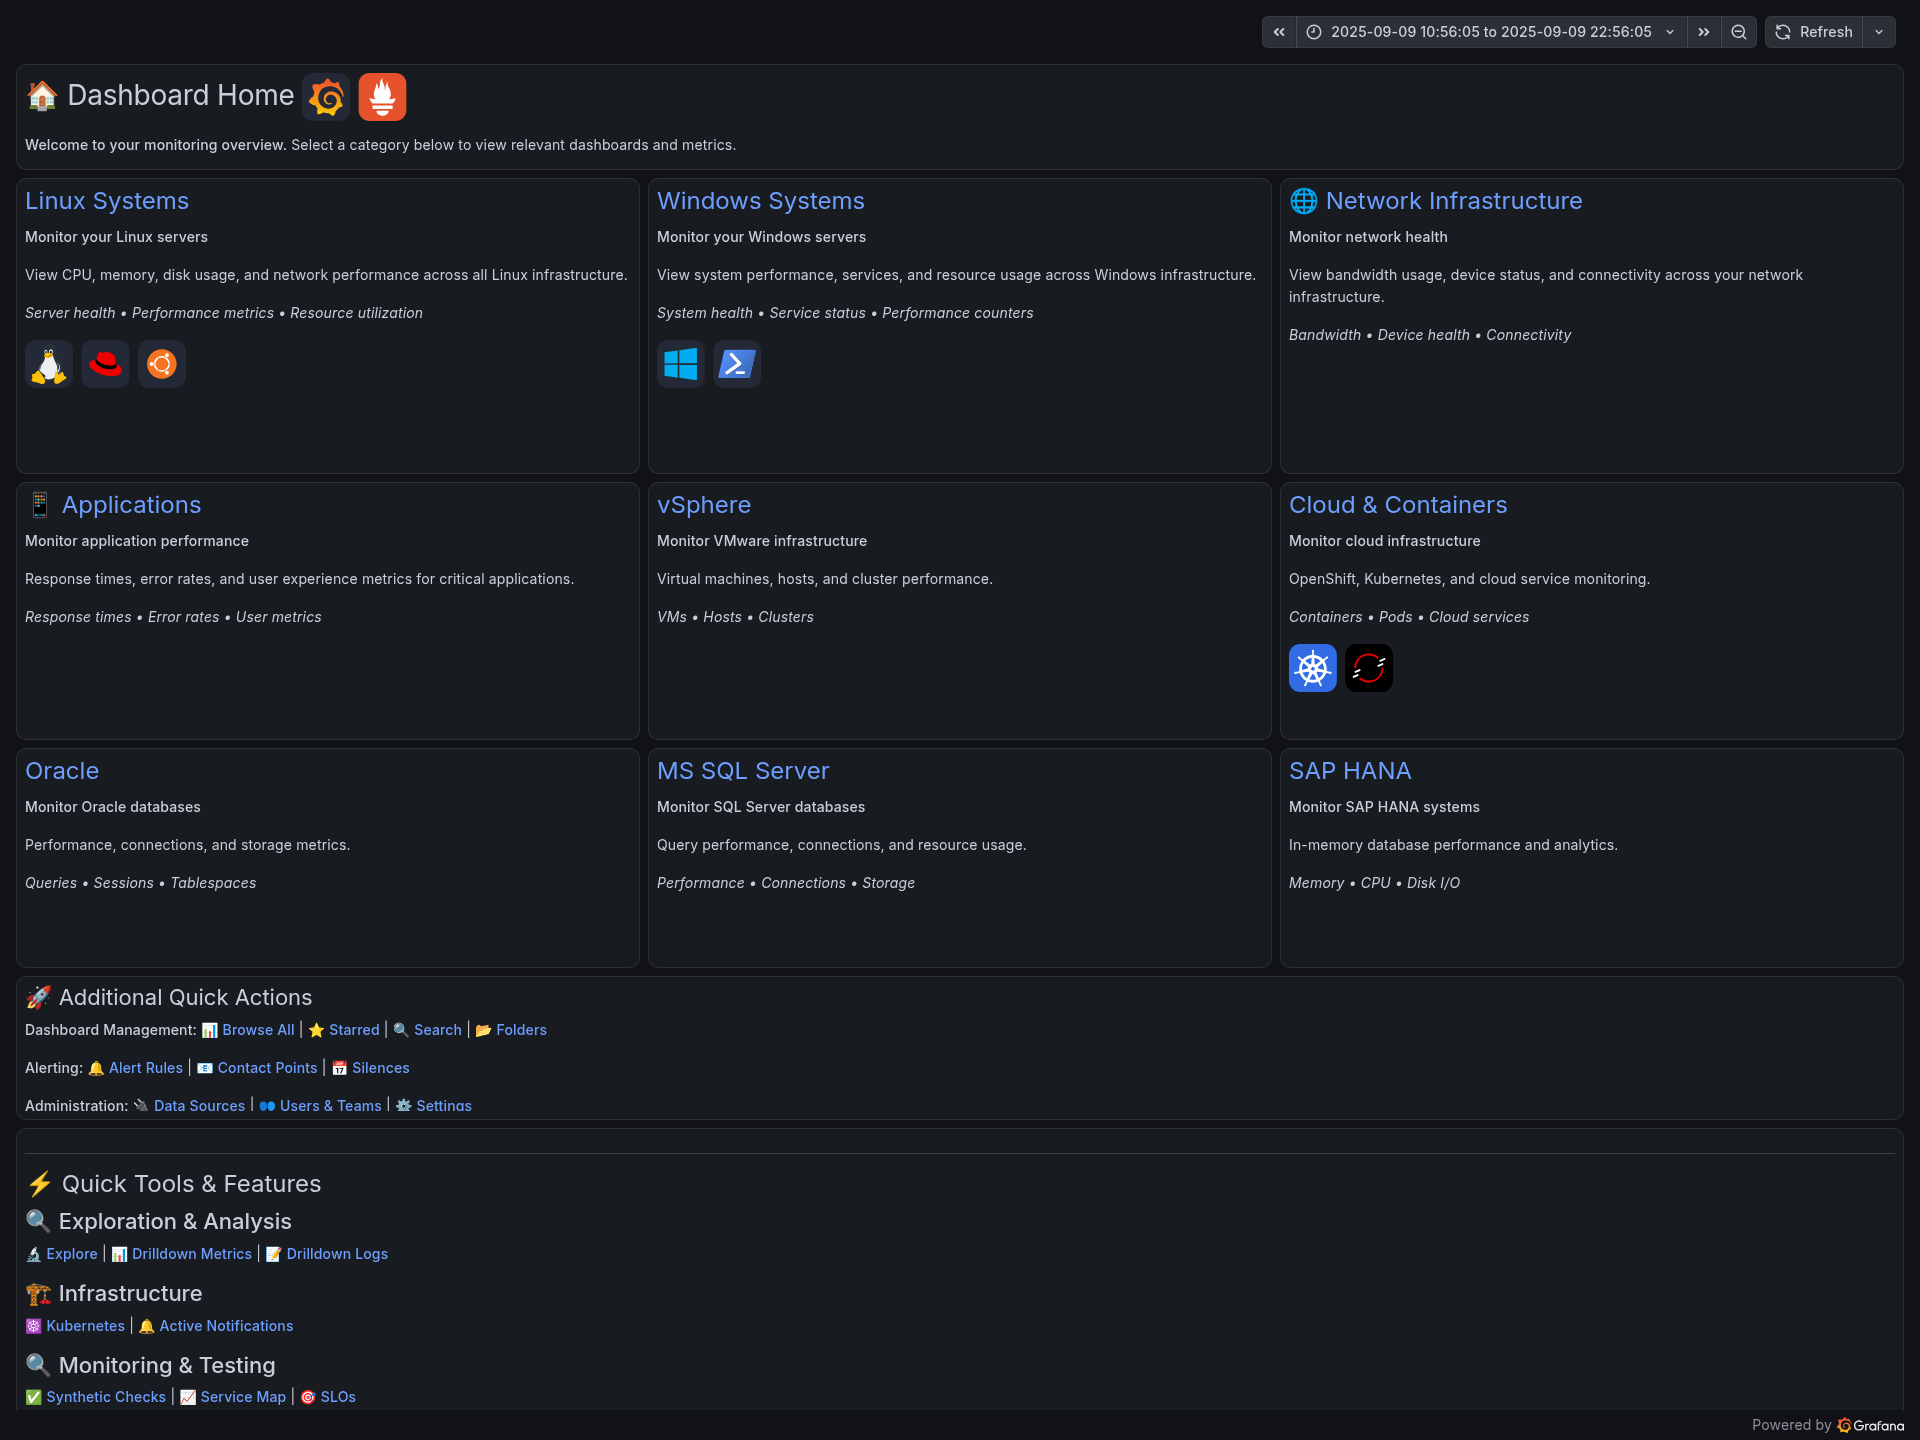
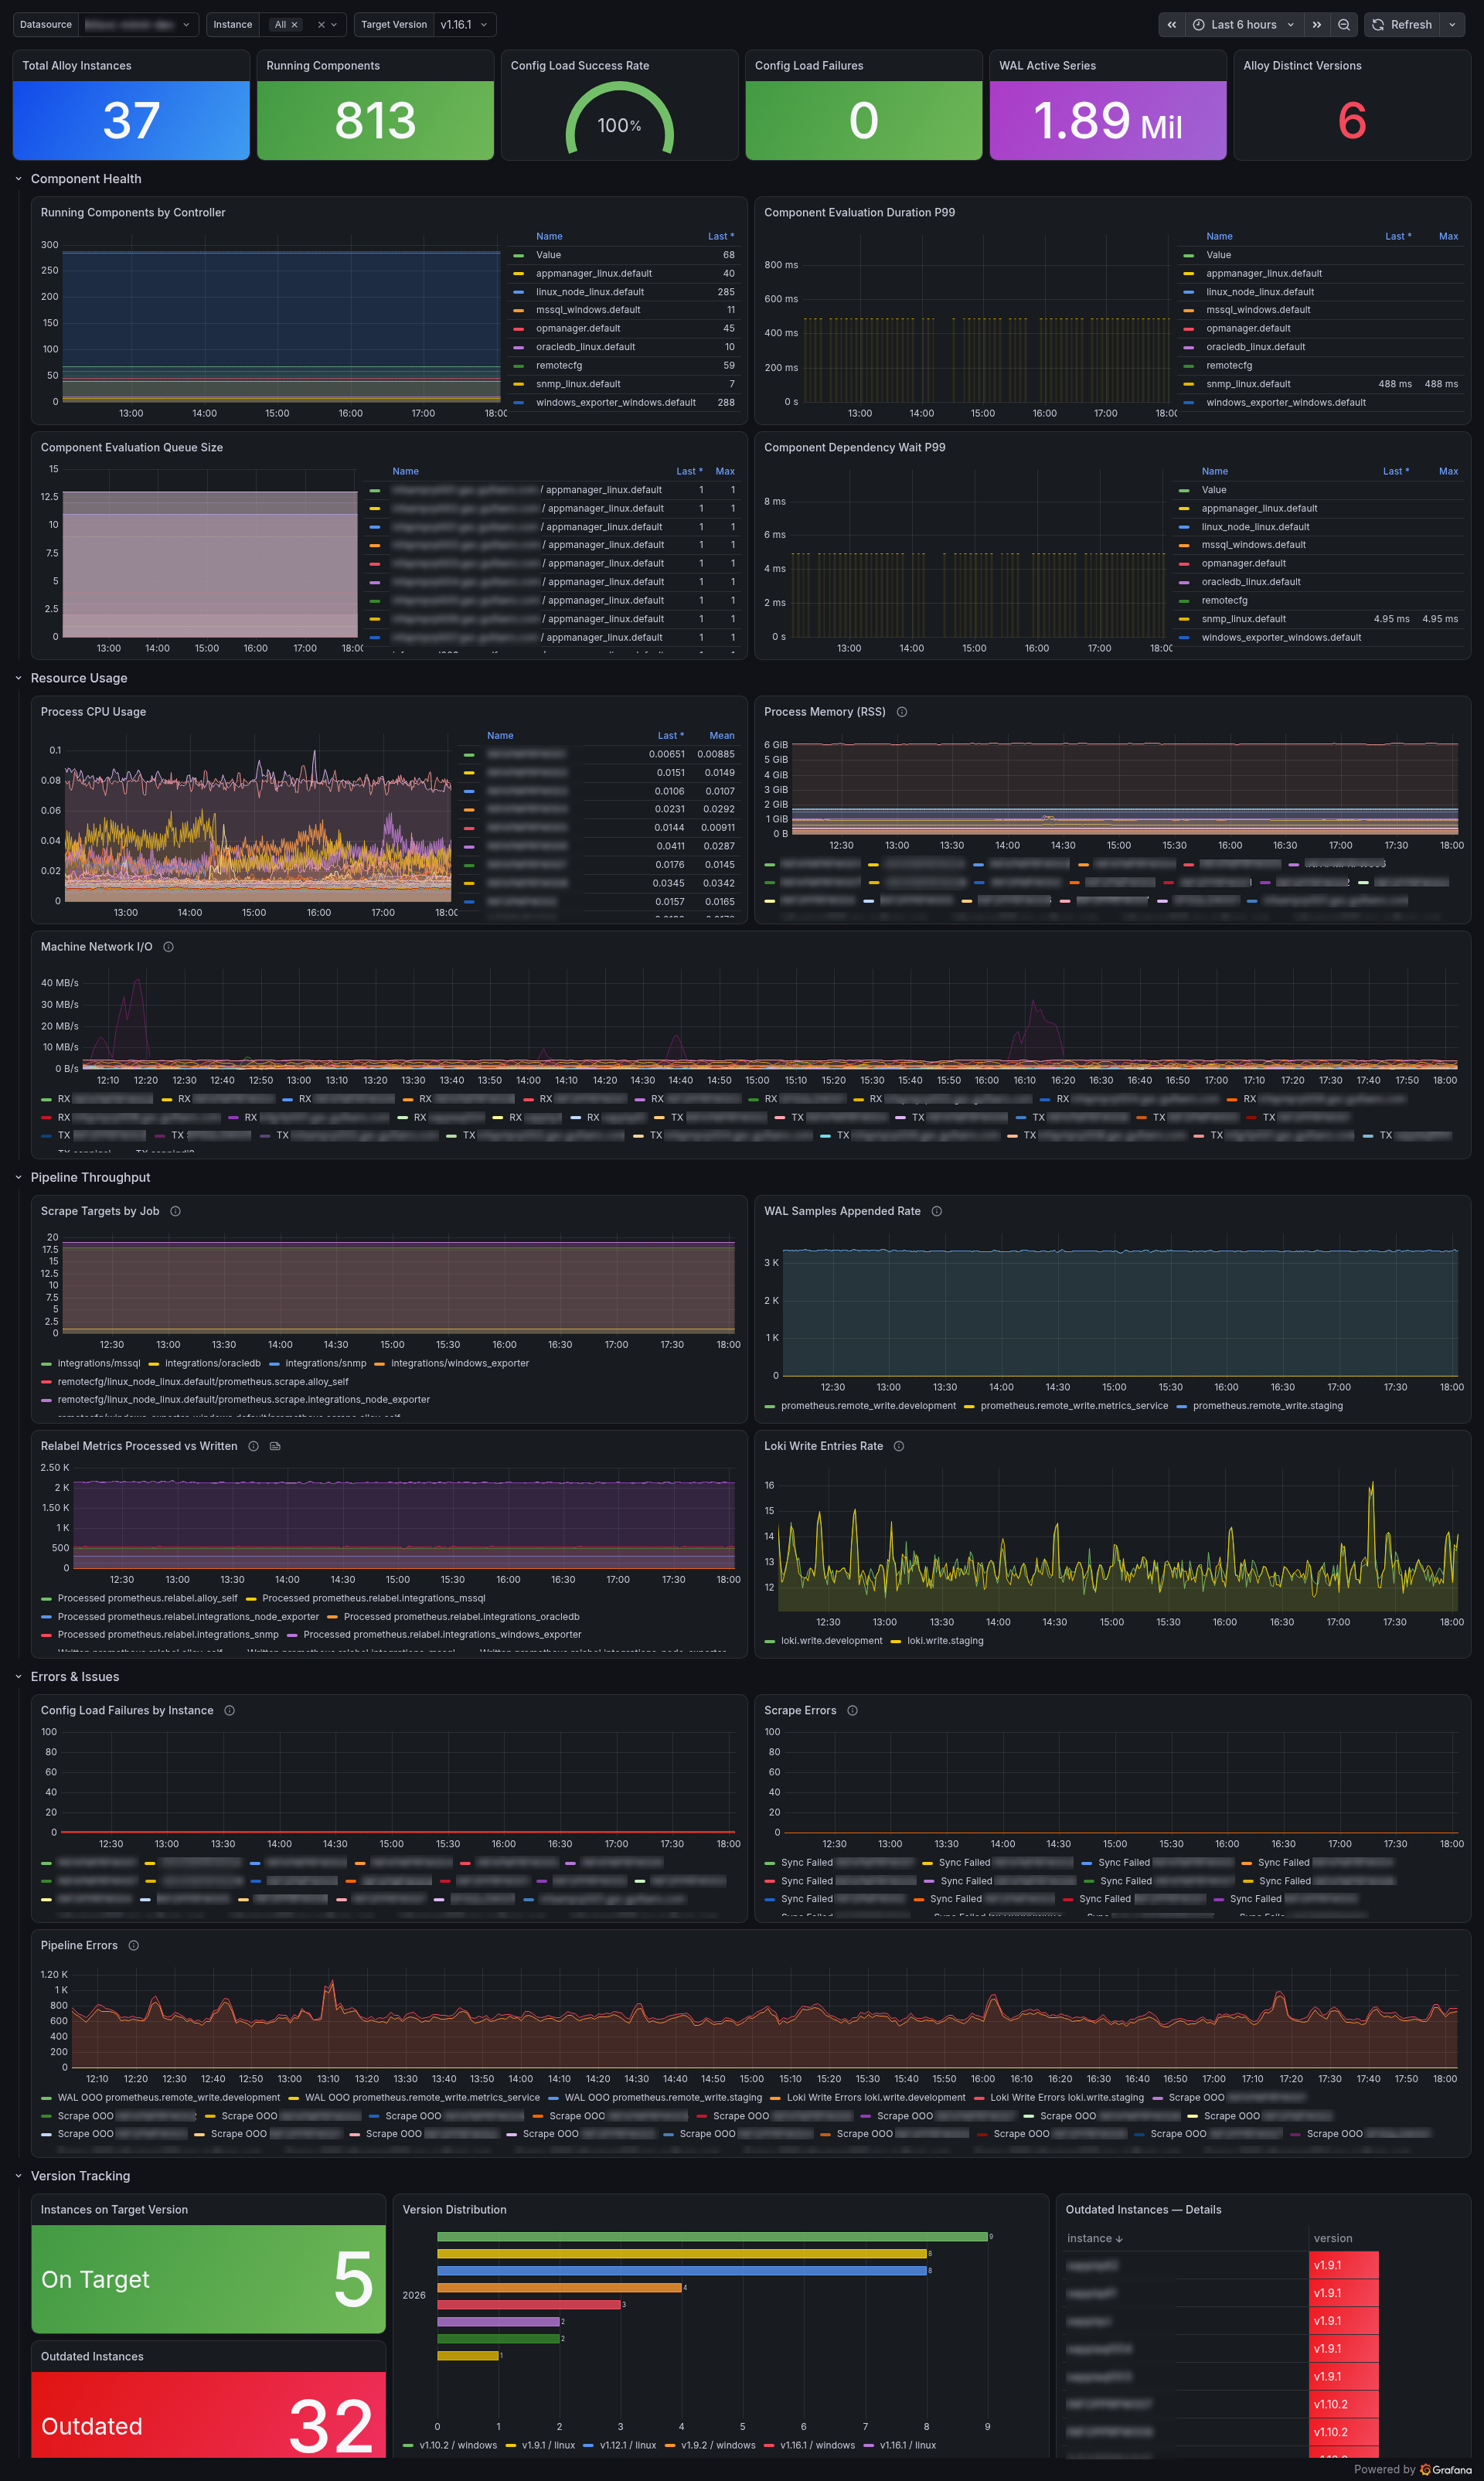
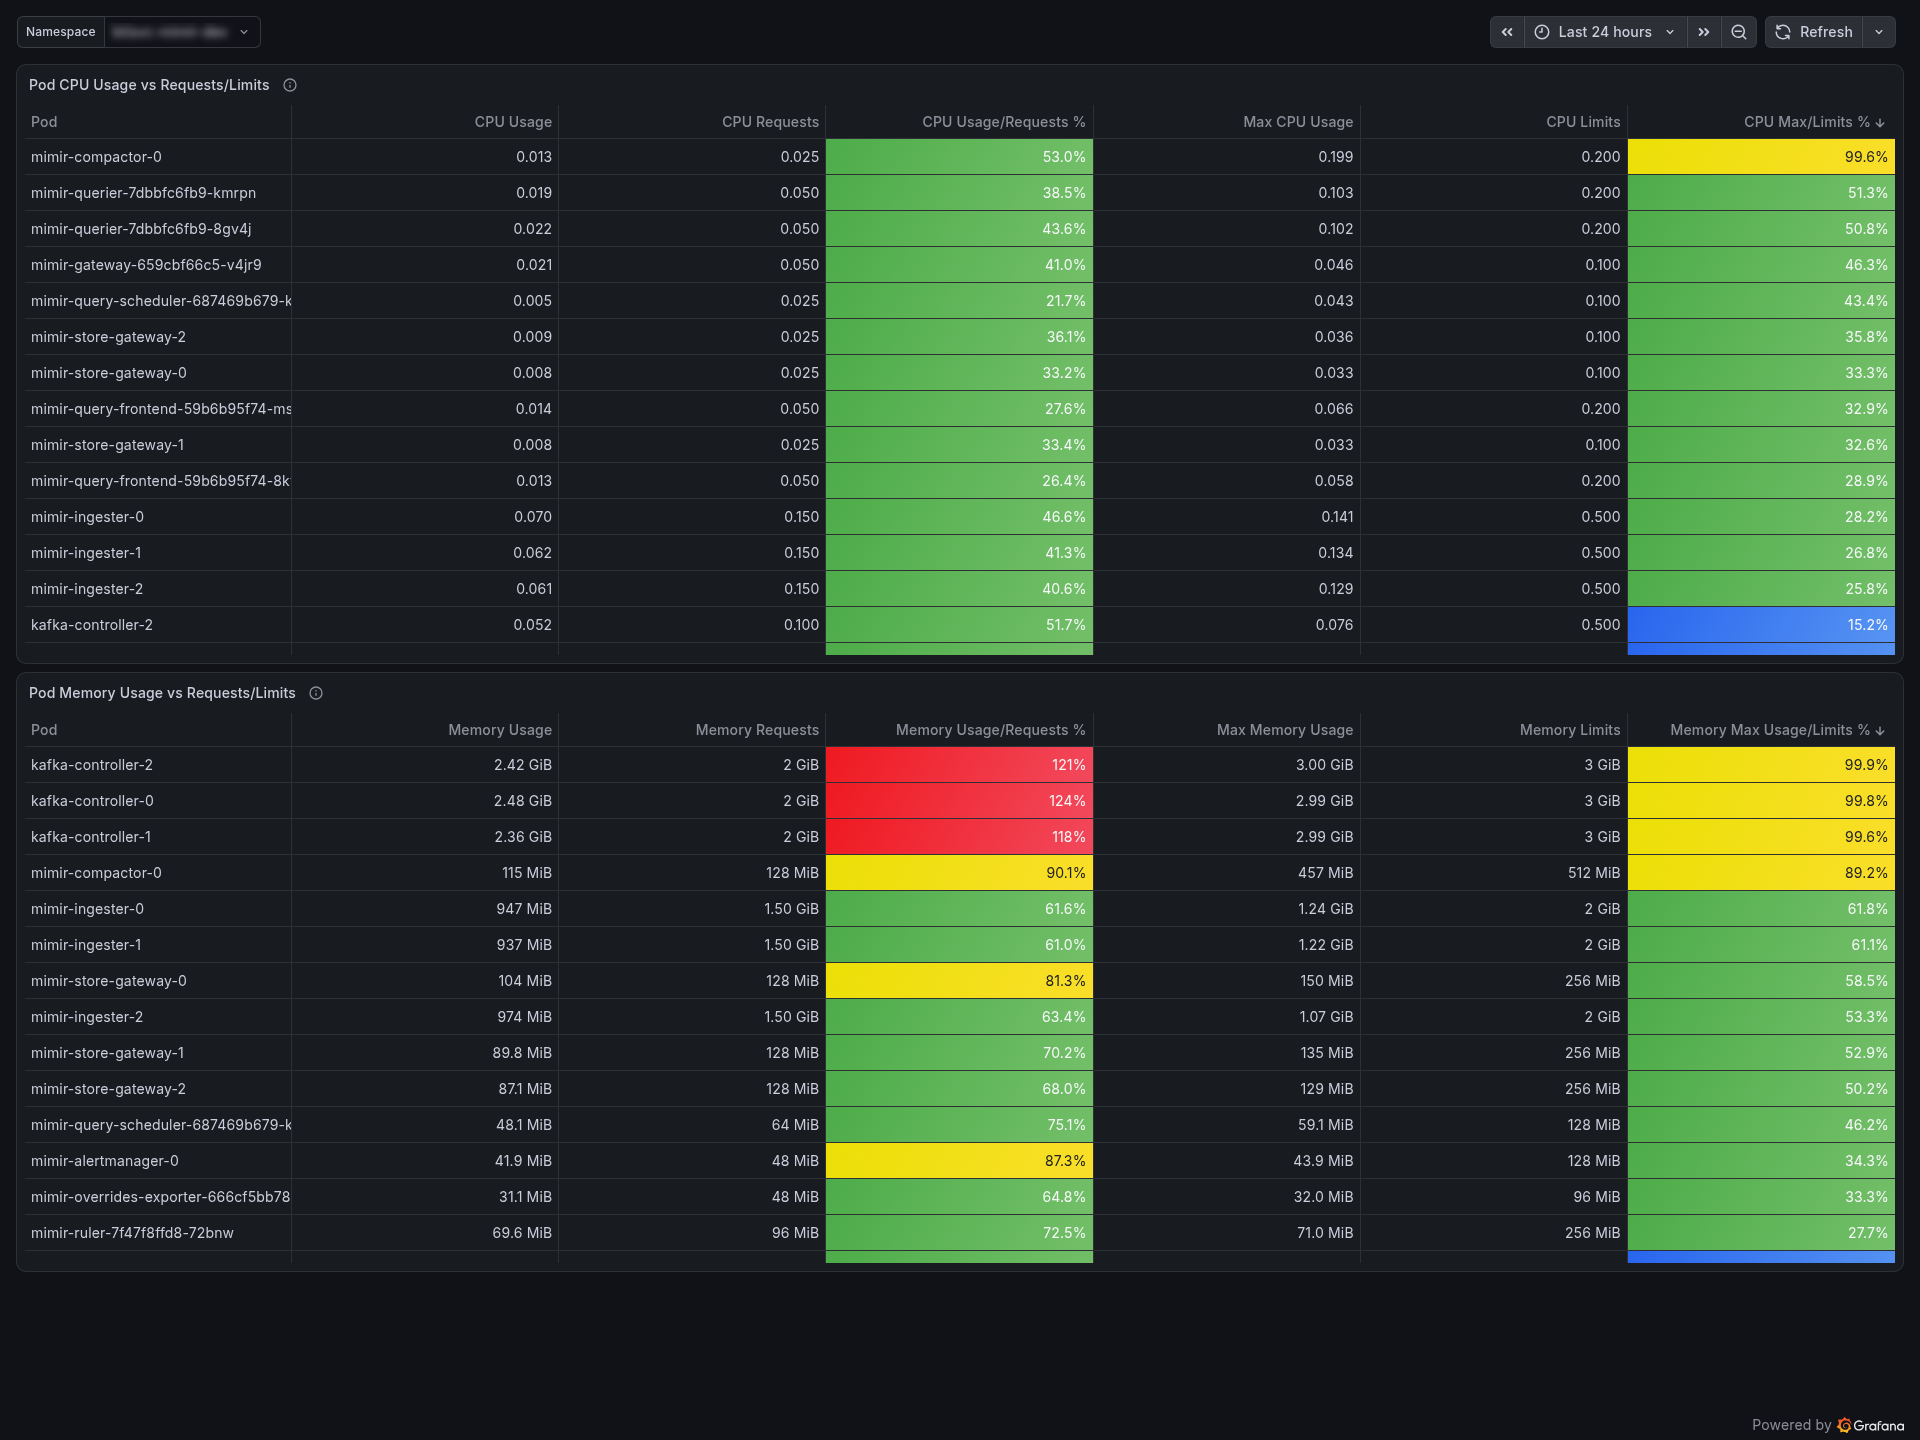
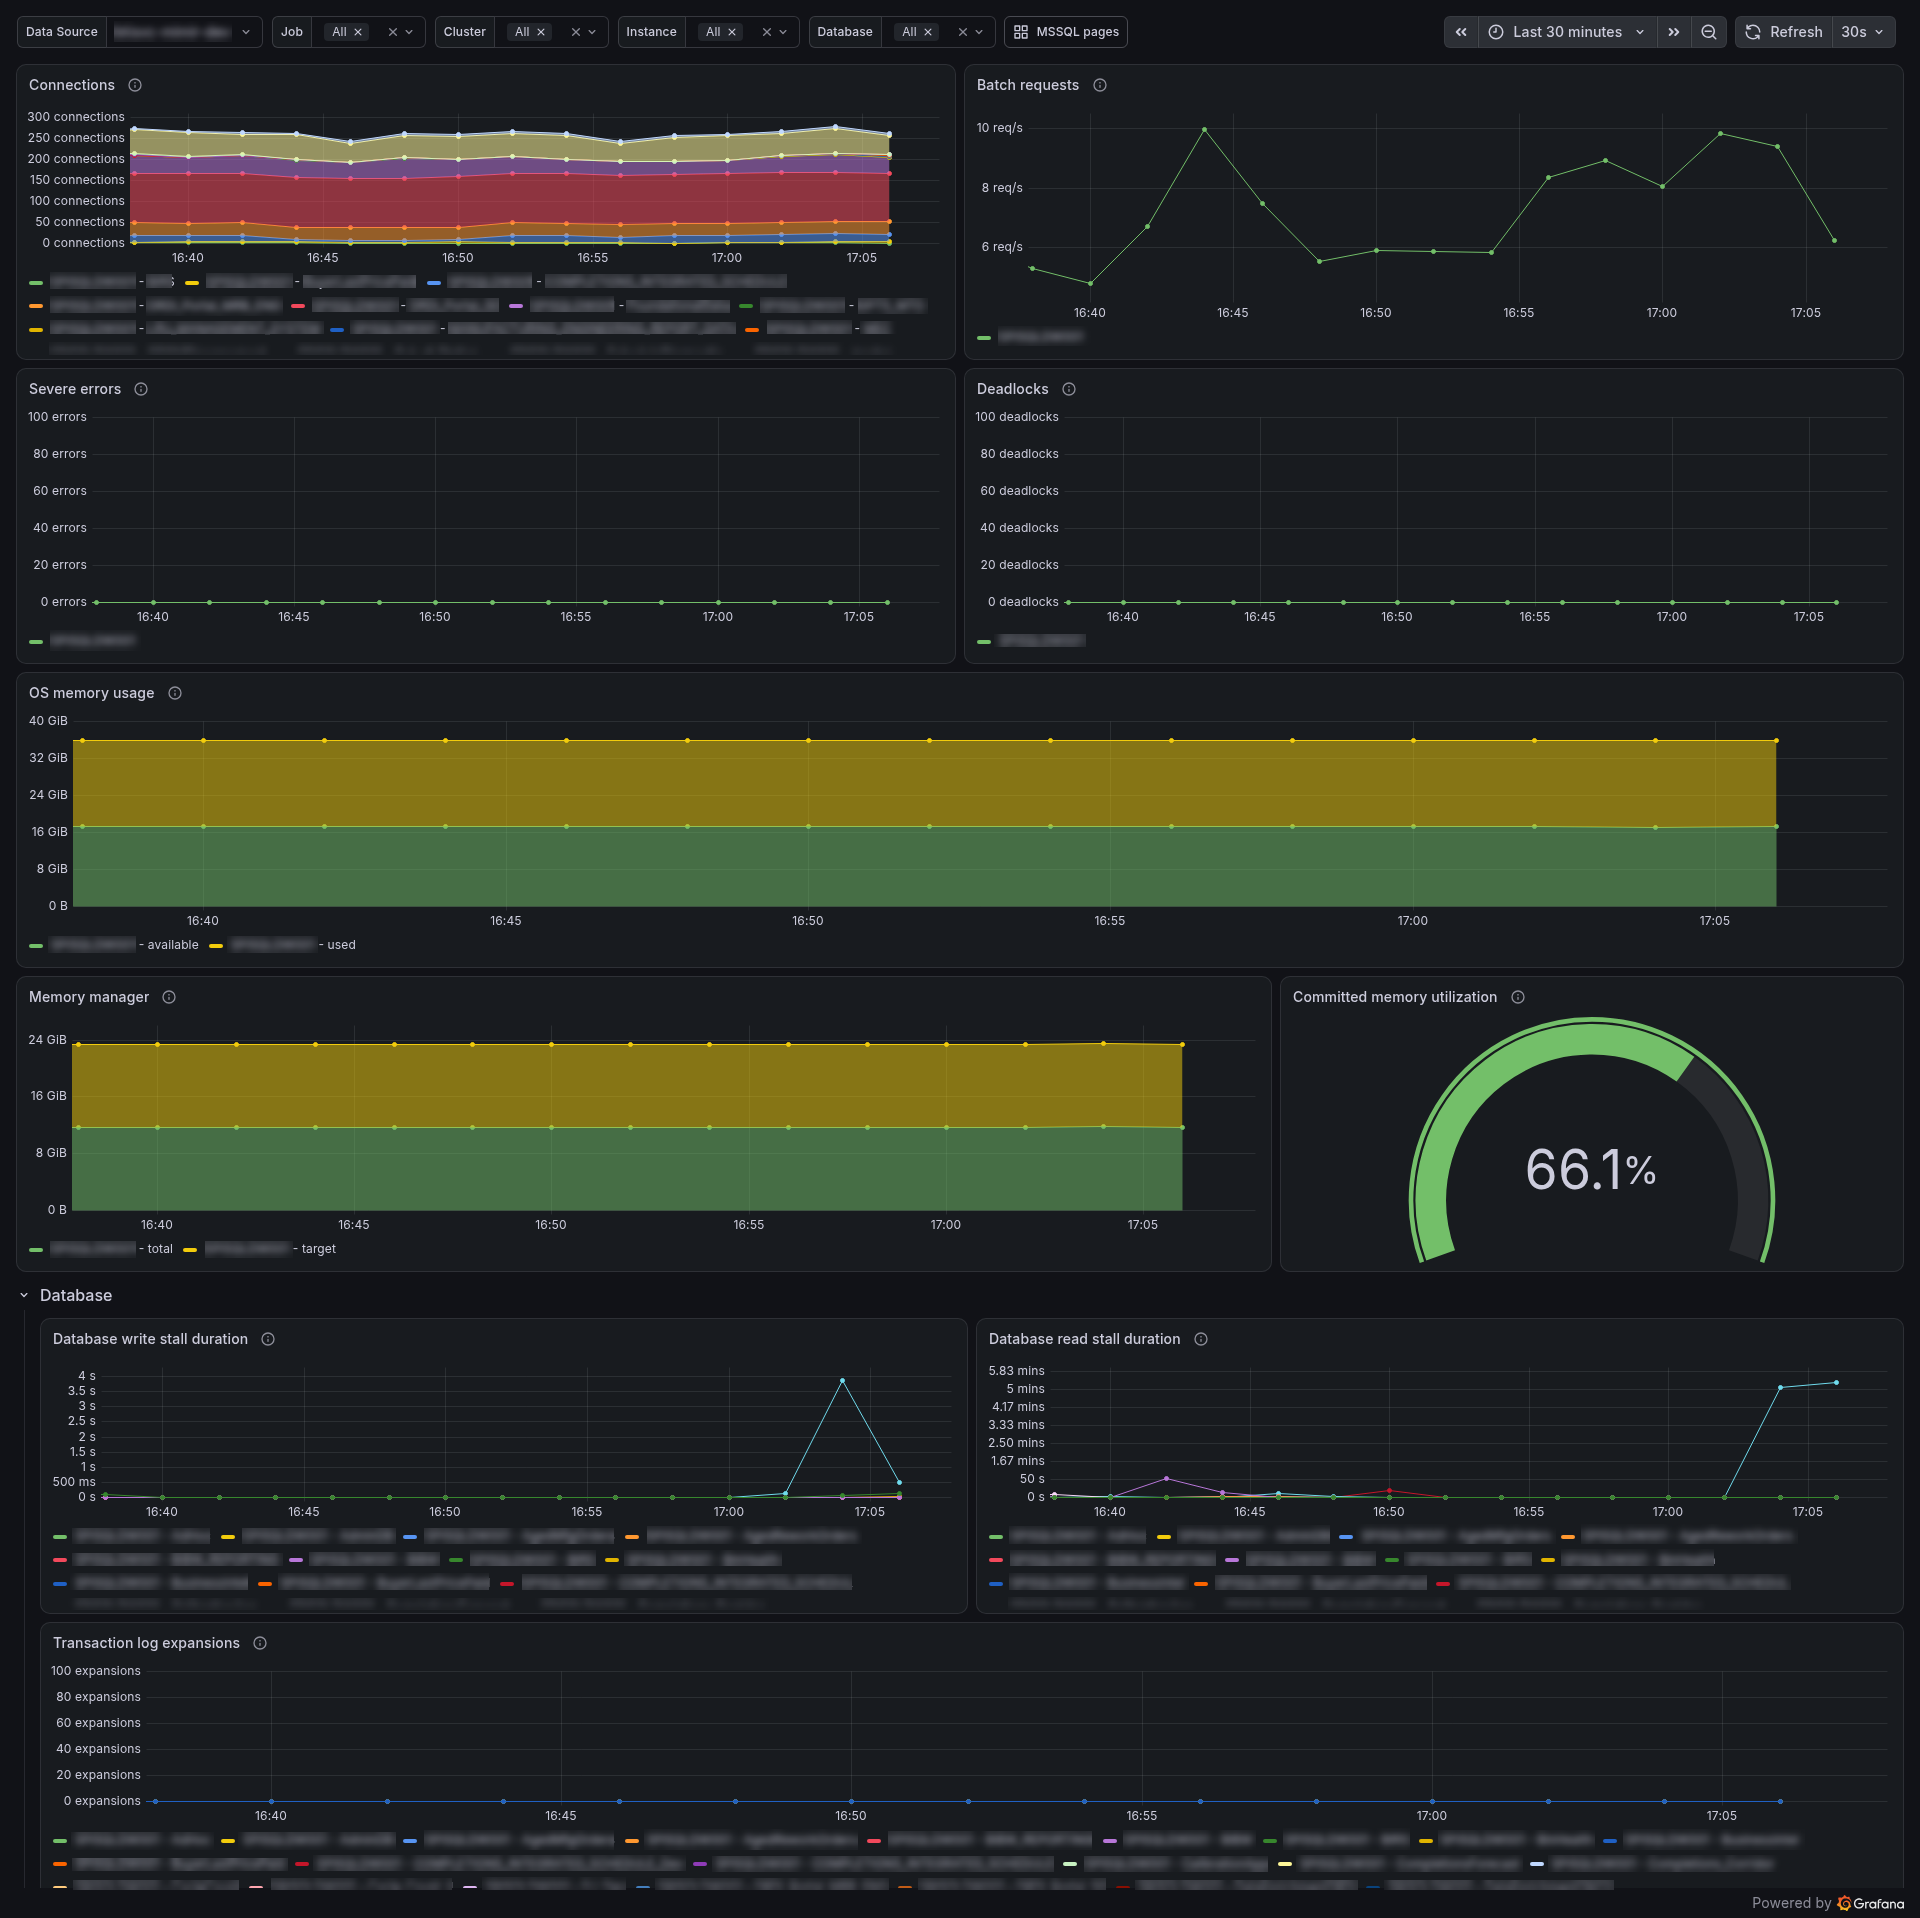
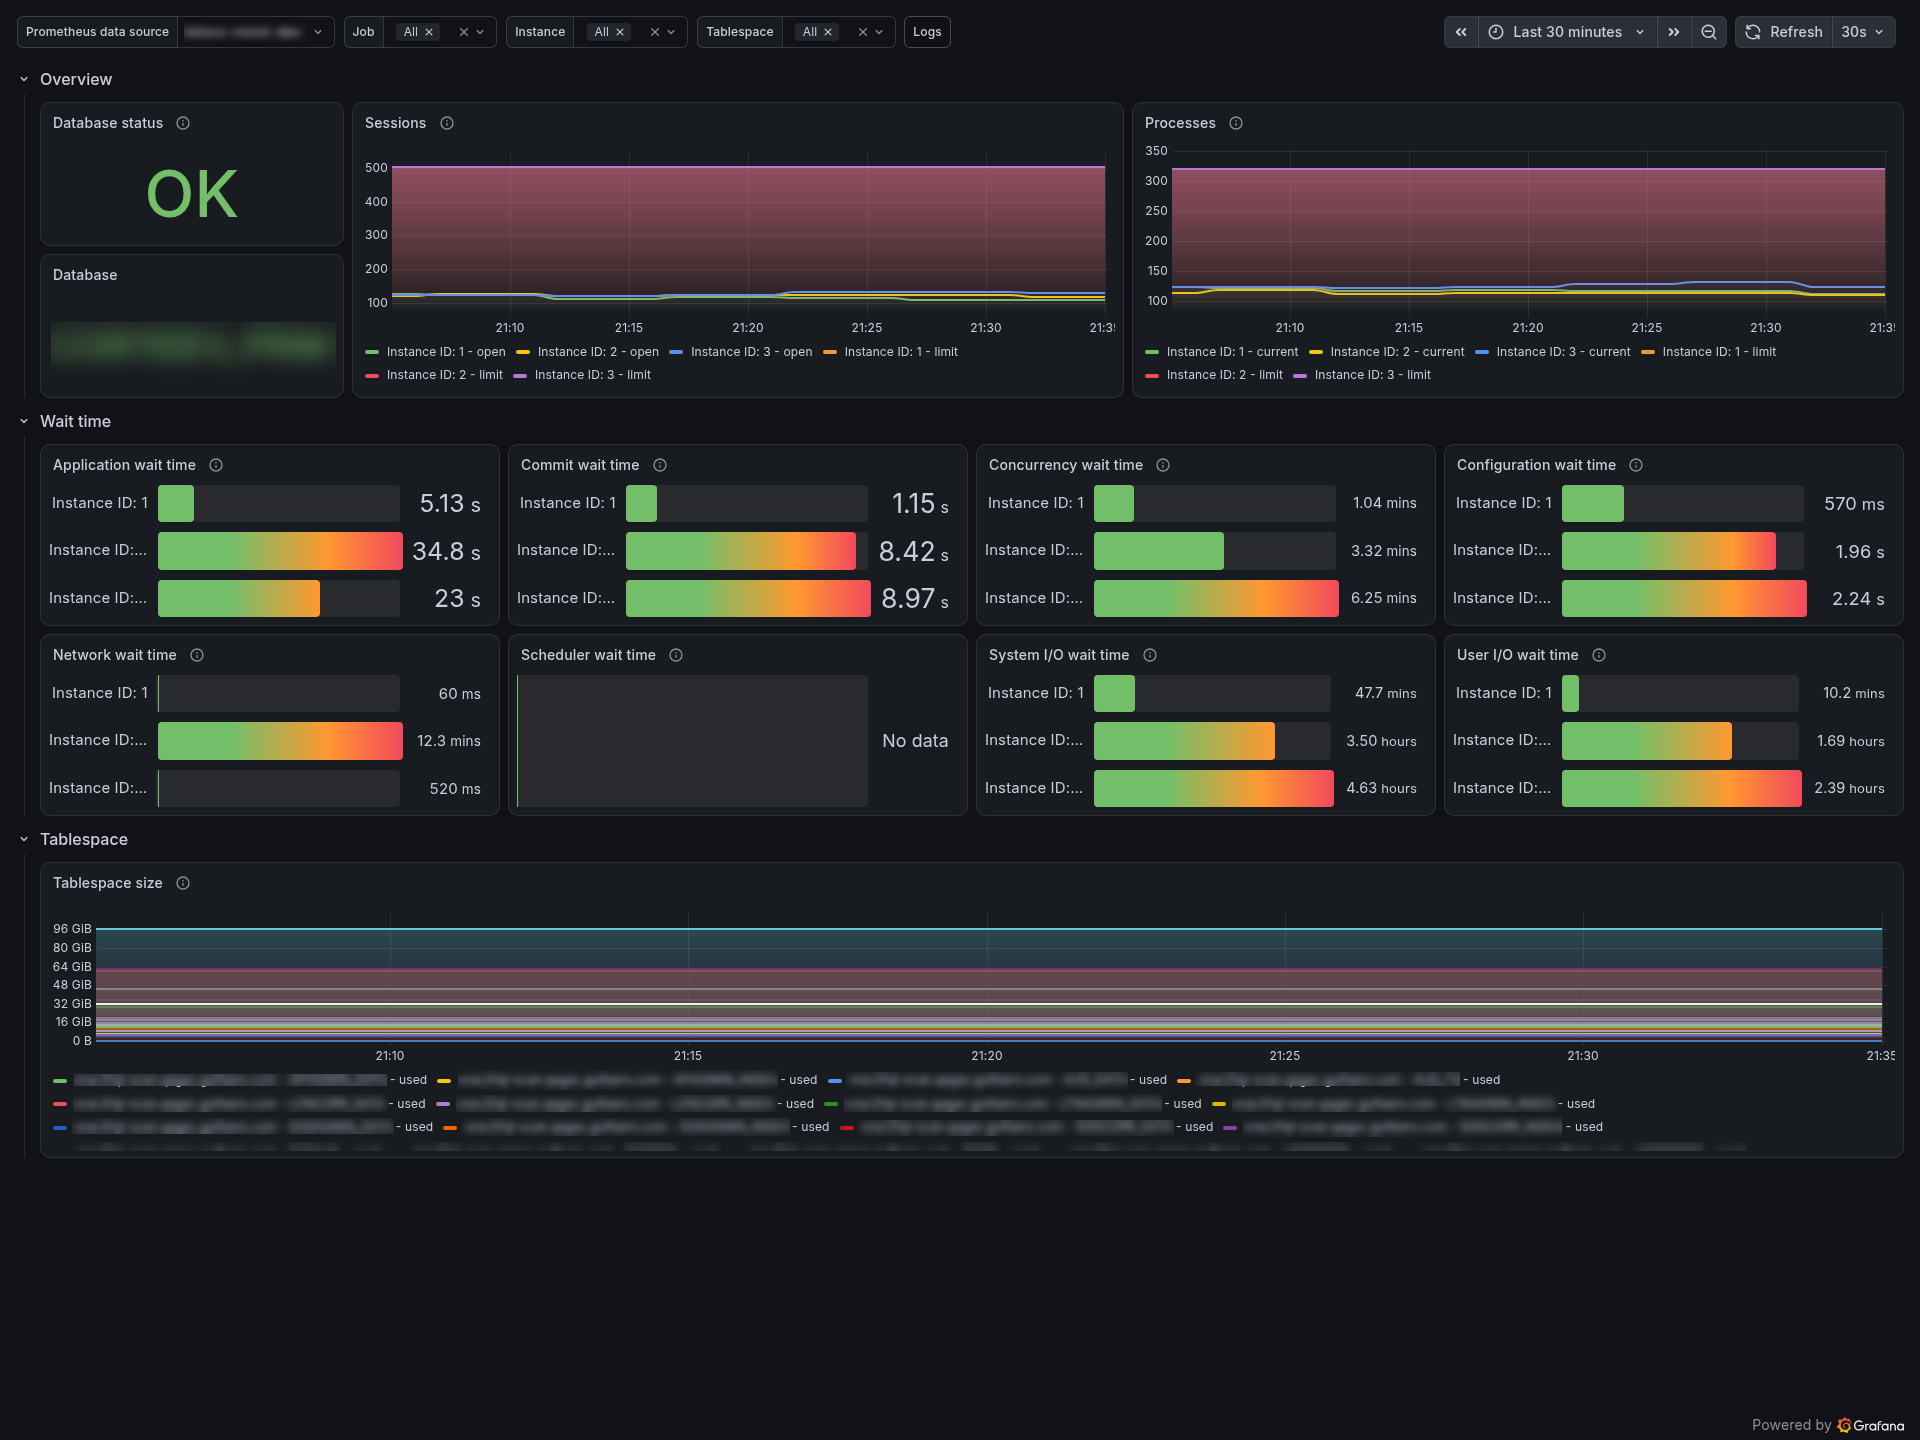
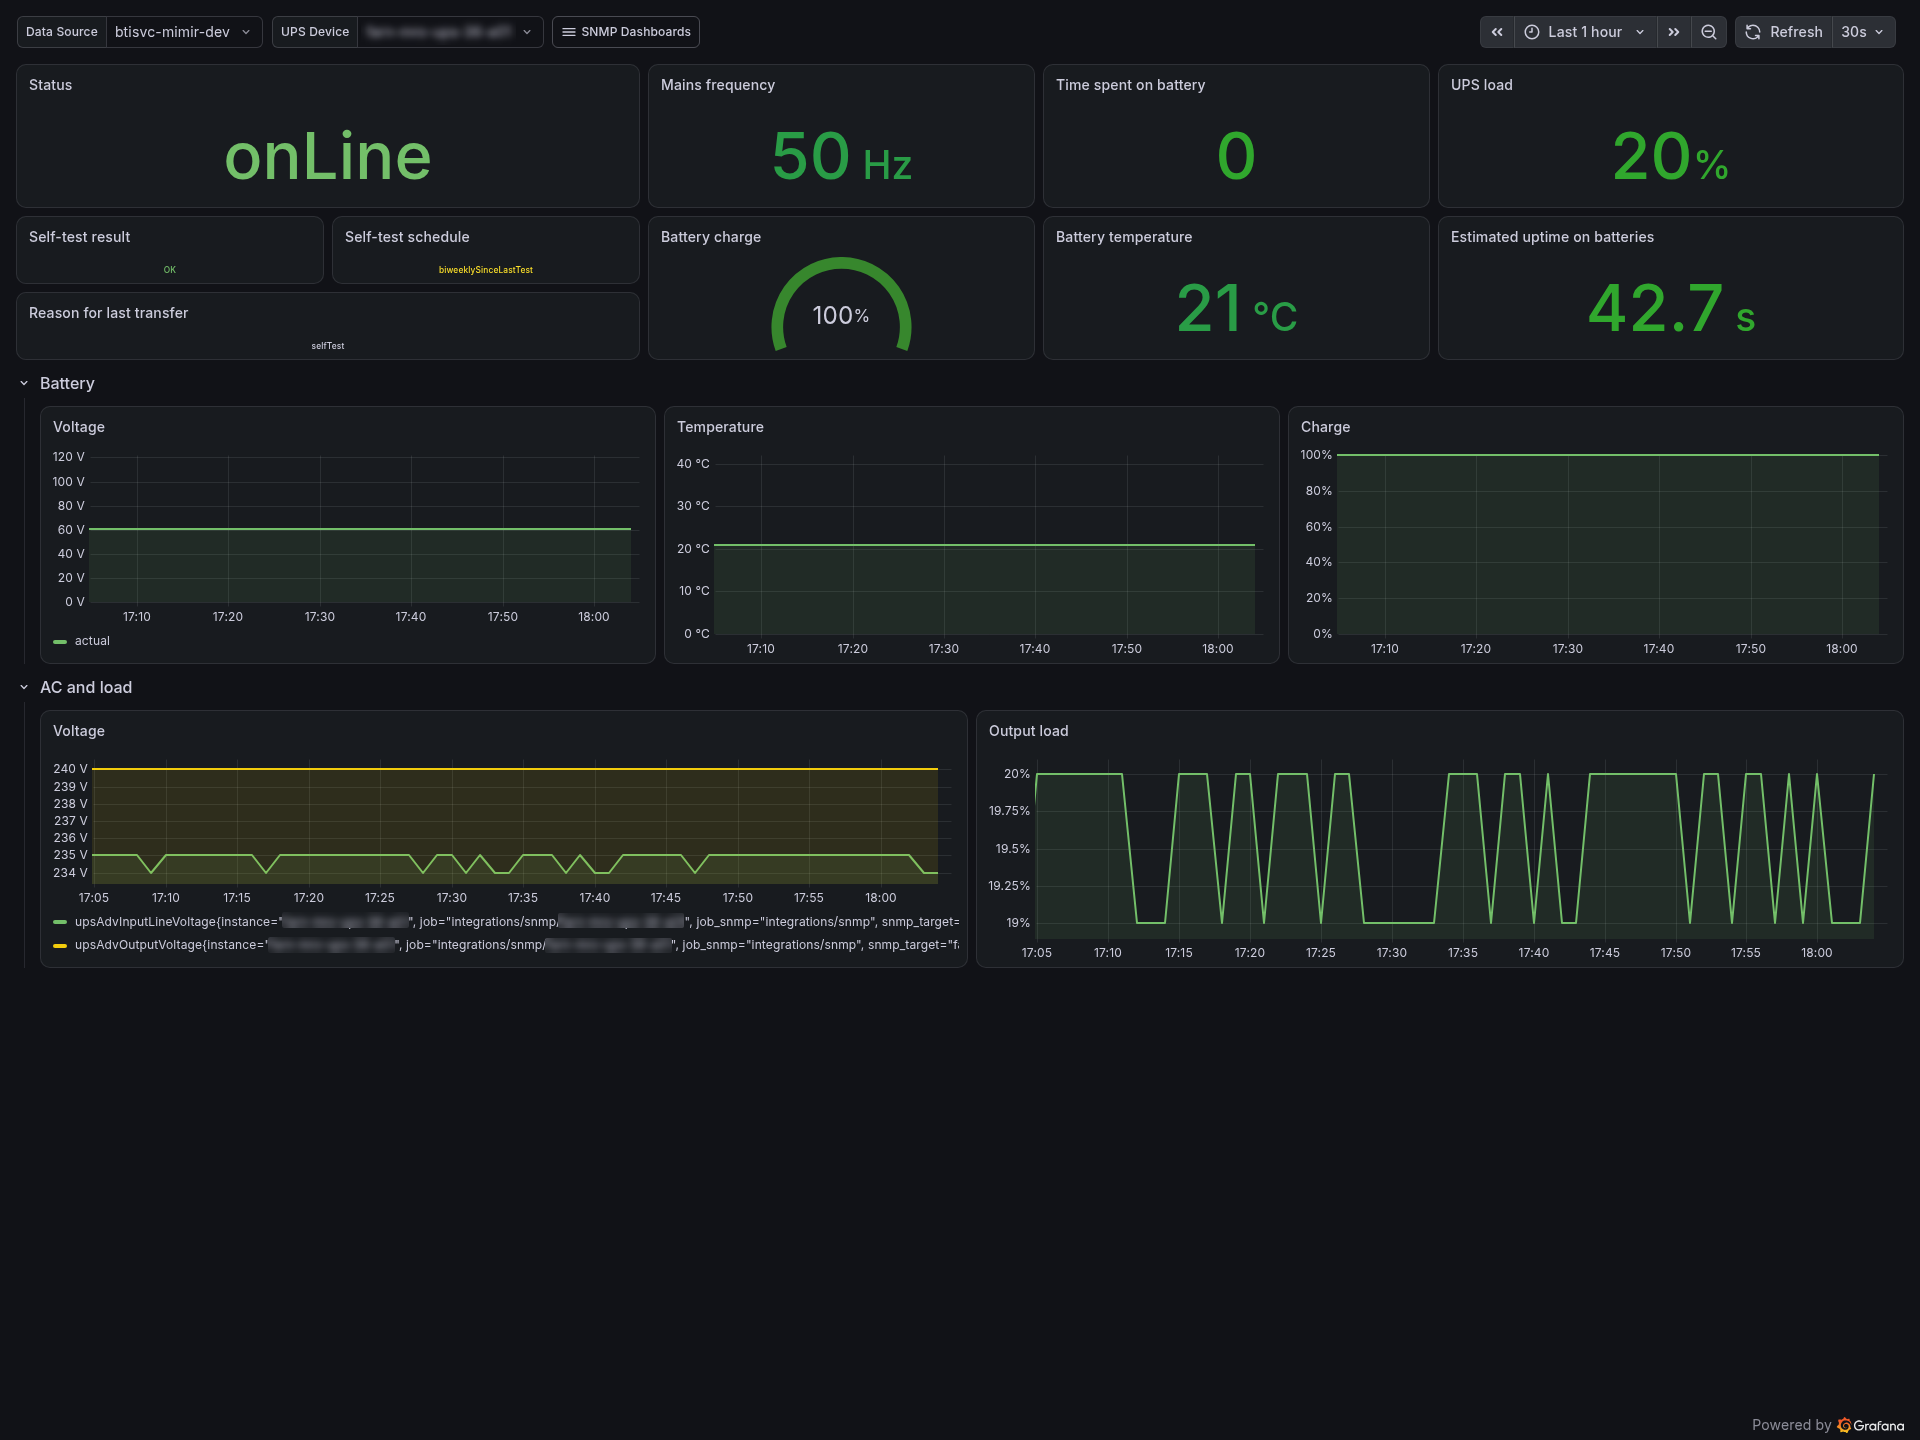
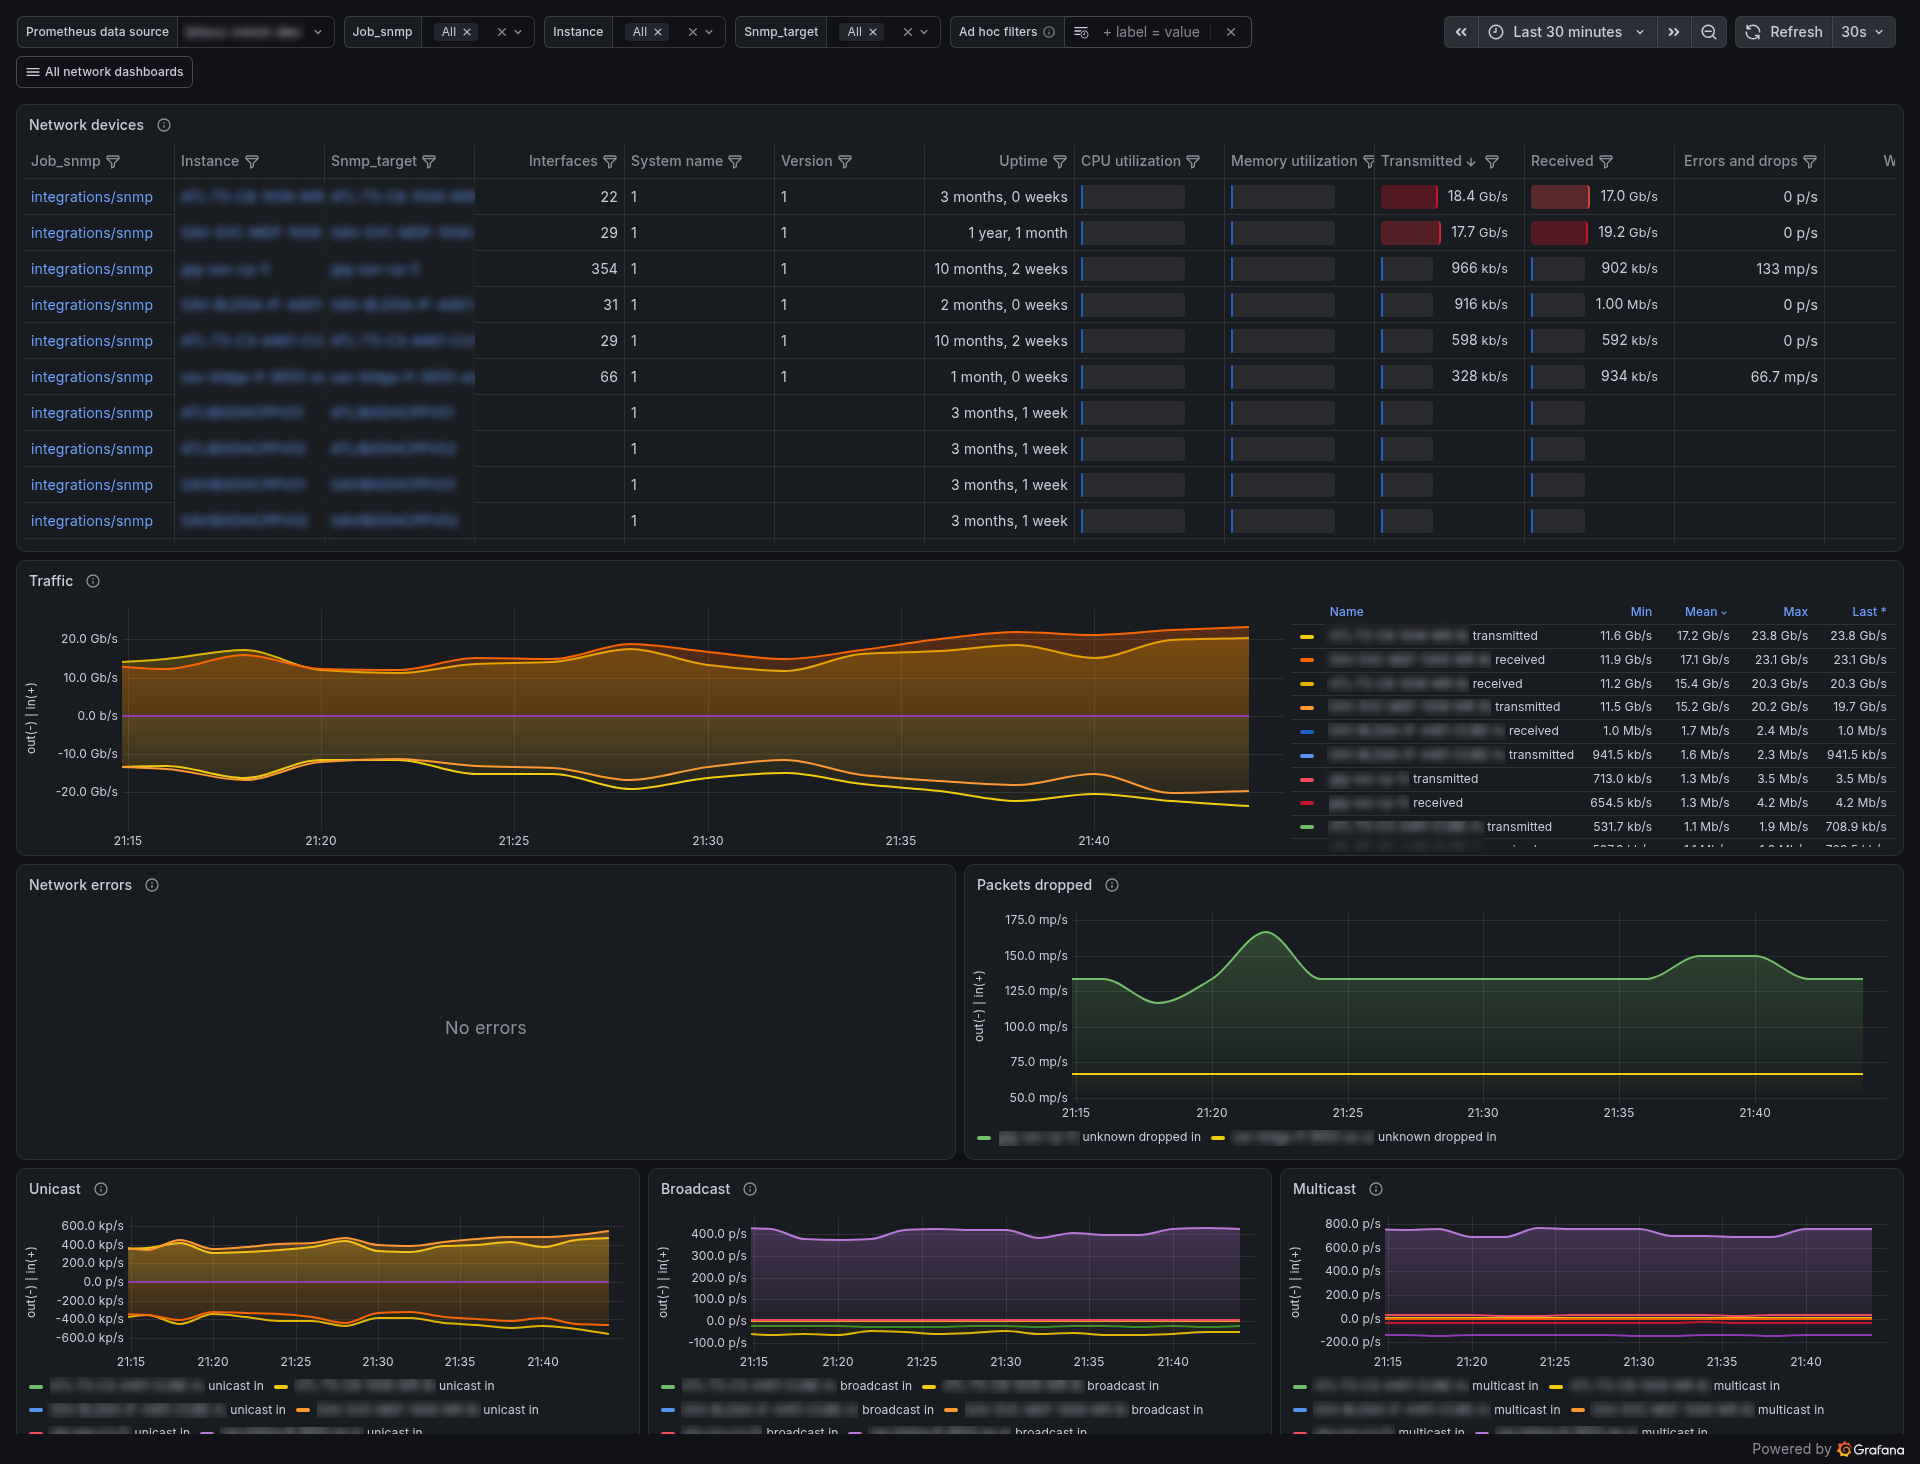
Dashboards rebuilt on the new stack, grouped by monitoring domain. Click any screenshot to view it full size.